HousingWire
Not yet, but we are getting closer to another recession red flag.
By Logan Mohtashami
Tuesday, the new home sales report officially put that sector in the penalty box, and we are very close to raising the fifth recession red flag. When new home sales and housing starts begin to fall together, a recession is usually not far away. However, like everything else in economics, this report needs context. It can confuse people who don’t know the difference between the new home sales sector versus the existing home sales sector.
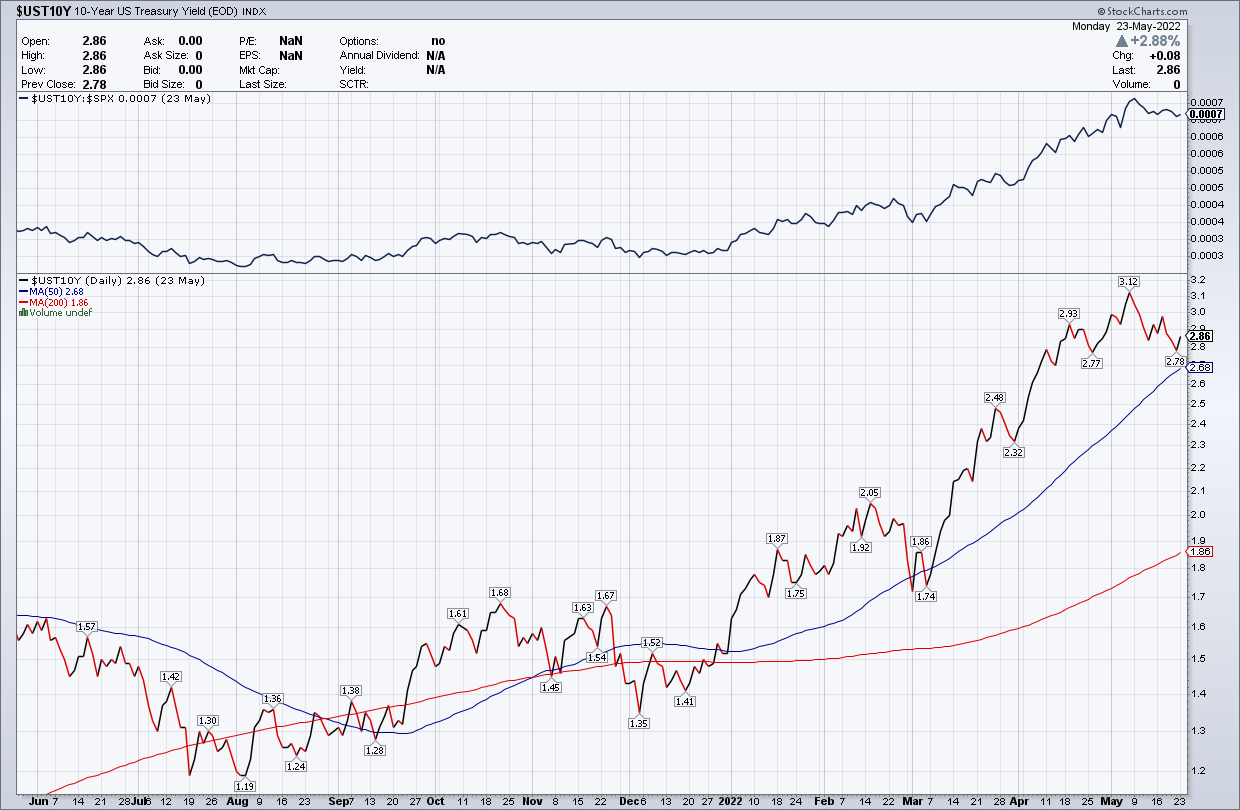
A few months ago, I wrote that the new home sales sector is at risk because of rising mortgage rates. A lot of the housing data was lagging the rate move, so it wasn’t apparent that higher rates impacted the data yet. Going back to the summer of 2020, the one factor that I said could change the housing market was the 10-year yield getting above 1.94%. I know rates are low historically, but the rate of housing change will be impacted when the 10-year yield breaks over 1.94%.
Guess what happened in March?
All I am doing is staying consistent with what I have talked about for years now; rates matter, but it’s more of a rate of change for housing, which was the same thing that happened in the previous expansion. Except now, we have had massive price gains in 2020, 2021 and 2022. The market is savagely unhealthy and needs balance; this is what we call balance!
I know some people don’t agree with me on this, but the price gains in both the existing home and new home sales sector show that homebuilders and sellers had too much pricing power and needed to be checked. The only way this happens is by higher rates.
From Census: Sales of new single‐family houses in April 2022 were at a seasonally adjusted annual rate of 591,000, according to estimates released today by the U.S. Census Bureau and the Department of Housing and Urban Development. This is 16.6 percent (±10.4 percent) below the revised March rate of 709,000 and is 26.9 percent (±13.7 percent) below the 2021 estimate of 809,000.
As we can see below, the new home sales report just took us back almost to the 2018 levels — the last time when rates rose toward 5% and created a supply shock. As you can see, sales levels were never elevated like what we saw from 2002-2005. This housing cycle is and will always be based on real demand, versus the credit boom we saw from 2002 to 2005.
Slow and steady wins the race. These big headline prints tend to get revised to a more proper level. However, the housing market changed once the 10-year yield broke over 1.94%. 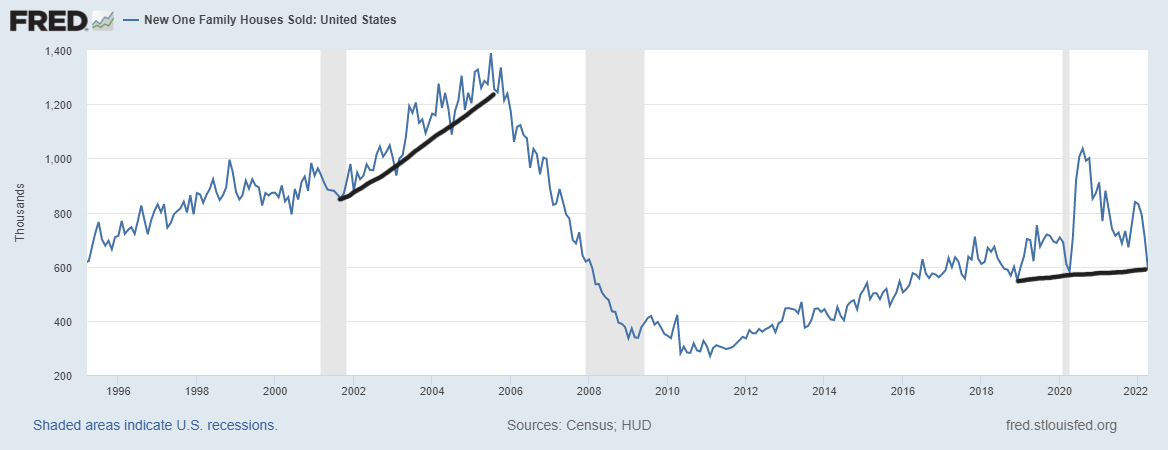
From Census: Sales Price The median sales price of new houses sold in April 2022 was $450,600. The average sales price was $570,300.
Keeping with the theme that the years 2020-2024 would be different, we can see the builders had pricing power, and they pushed it onto the consumer. Things will be different now, but balance is a good thing in the long run.
I understand why people will fight me on my position that higher rates are needed, but you have to remember that I created a specific price-growth model for housing just for 2020-2024, knowing that we could break out in an unhealthy way. As long as home prices only grew to 23% in those five years, we would be OK to have 6.2 million total home sales each year from 2020 to 2024. That didn’t happen, so rules are rules, and models are written for a reason. The chart below is worth a thousand words.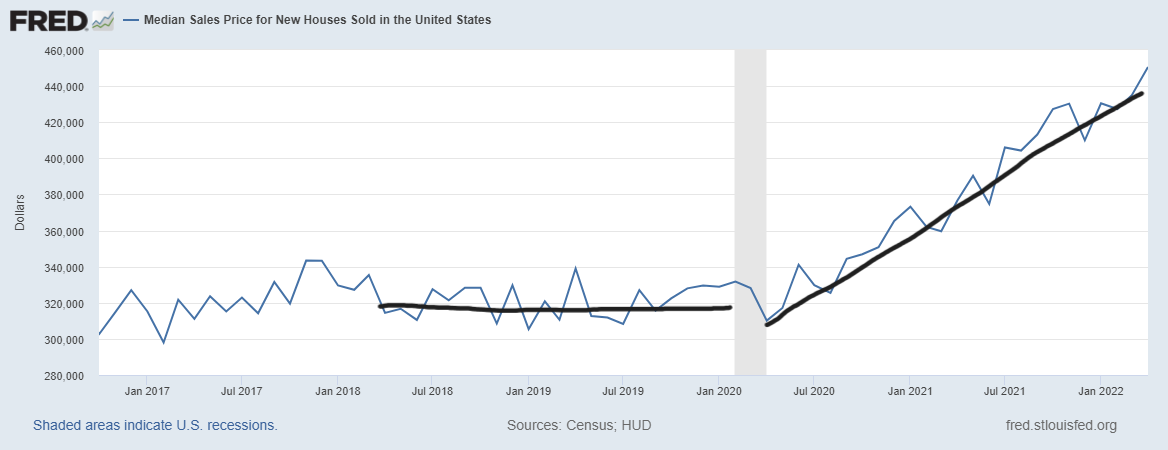
From Census: The seasonally‐adjusted estimate of new houses for sale at the end of April was 444,000. This represents a supply of 9.0 months at the current sales rate.
My rule of thumb for anticipating builder behavior is based on the three-month average of supply:
- When supply is 4.3 months and below, this is an excellent market for the builders. They will happily build.
- When supply is 4.4 to 6.4 months, this is just an OK market for the builders. They will build as long as new home sales are growing.
- When supply is 6.5 months and above, the builders will pull back on construction.
The monthly supply has spiked, the 3-month average is at 7.4 months, and the headline number is at 9.0 months!
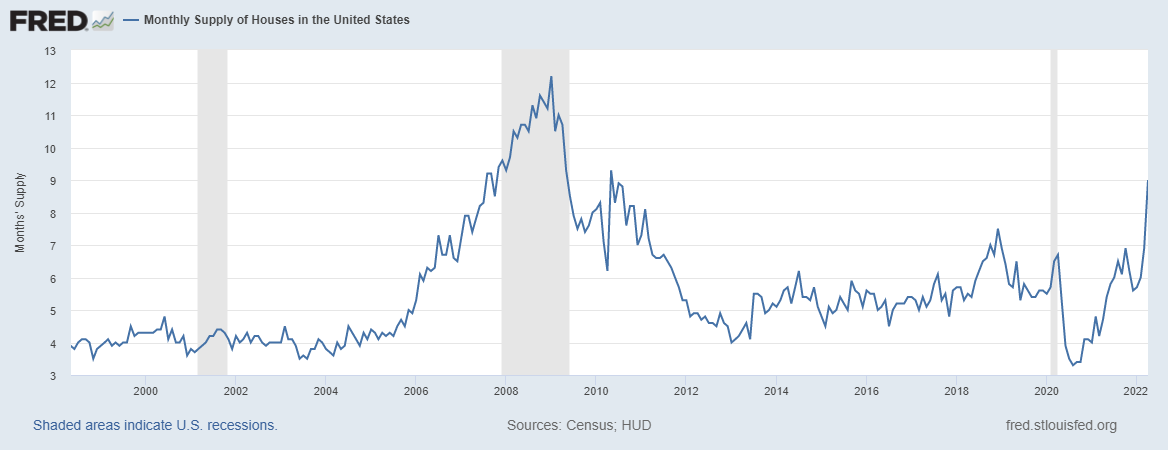
Before I go on, I need to remind readers that the new home sales market is different from the existing home sales marketplace. Even today people think this monthly supply spike is for the current home sales market. This isn’t the case; the monthly supply for existing homes is only 2.2 months.
My biggest thing is getting total inventory back to 2018-2019 levels, which can range from 1.52-1.93 million, and I can stop labeling this housing market a savagely unhealthy housing market. However, this isn’t going to help much because the existing home sales market has a different inventory channel.
Now inventory is rising in the existing home sales market, and we just had some positive weekly year-over-year prints. Still, the existing home sales market has an active seller who decides to sell their home to buy another one or rent. Unless you’re an investor, that is the traditional supply decision-making, which has made it hard for inventory to grow outside of extreme housing weakness or forced selling to get inventory above six months. The only time this has happened was the 2006-2011 period.
The new home sales sector is much different — it’s a contract to purchase a home that isn’t built yet. What do we have now? A massive backlog of homes that weren’t finished and even some that haven’t started yet! Yes, the builders have issues as rates have risen on them and this will impact the single-family construction aspect of their business. However, this is much different than what we saw from 2002-to 2005.
It’s not shocking that the housing market turned once the 10-year yield broke above 1.94%. However, this marketplace, both for the new home sales sector and the existing home sales market, is much different from the run-up in demand we saw from 2002-to 2005. We have proper models and data to look at for housing that track where the sector is going, which doesn’t rely on home prices crashing down back to 2012 levels.
As long as rates stay higher, the market will create the balance it needs. The next economic take will be when the recession red flag No. 5 will be raised because housing starts tend to fall into a recession. The only reason I am not raising the flag today is that this is the new home sales report not the next housing starts report. The economic cycle is getting more and more interesting and we will go through it always one data line at a time.
Logan Mohtashami, Lead Analyst for HousingWire, is a housing data analyst, financial writer and blogger covering the U.S. economy, specializing in the housing market. Mohtashami’s work is frequently quoted in BankRate.com and Bloomberg financial. He has been an invited speaker at the Americatlyst, California Association Of Realtors, and other economic conferences.