Inman News
The recent inventory increase and the slowdown in price appreciation is not a coincidence and may be signaling good news for those considering buying a home.
This article was originally published by First American and has been reprinted with permission.
Last month, we noted in our latest Real House Price Index (RHPI) report that house price appreciation may be slowing. According to our RHPI, 21 cities experienced a monthly decline in their real, consumer house-buying power-adjusted price level.
One reason for the price appreciation slowdown is that 21 of the 50 largest cities in the U.S. experienced an increase in the number of houses on the market in July compared with a year ago, according to realtor.com data.
So, is the supply shortage in the housing market beginning to ease? And more importantly, what does it mean for potential future homeowners?
Inventory ticks up for higher-priced homes
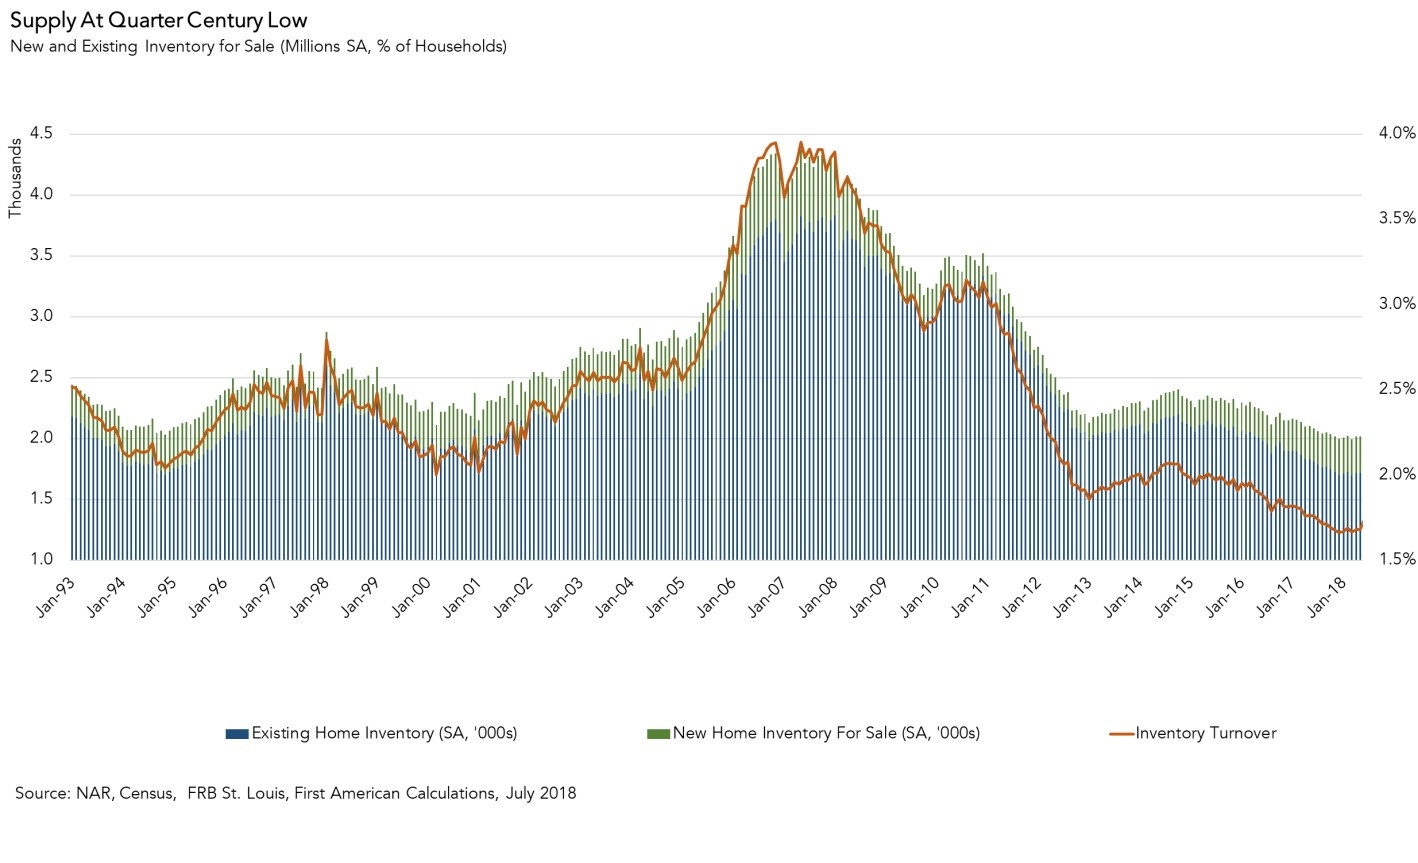
Inventory appears to have increased modestly since December 2017, which marked the 25-year low-point.
Last December, inventory turnover (the total supply of homes for sale nationwide as a percentage of occupied residential inventory) was 1.66 percent. In other words, only 166 homes in every 10,000 were for sale, which is well below the historical average of about 250 in every 10,000.
In July 2018, the inventory turnover rate increased to 1.74 percent. While still very low, it’s the first time we’ve reached this level since July 2017, and it represents an ever-so-slight improvement from December’s 25-year low point.
However, it’s important to note that the supply shortage appears to be easing only among higher-end homes nationally. In July, the inventory of homes worth less than $200,000 was down 15.6 percent nationally compared with a year ago, but the supply of homes that cost more than $350,000 increased 5.7 percent, according to realtor.com data.
Local real estate trends support this overarching national trend, since it appears that the supply shortage is primarily easing in more expensive cities. The five cities that saw the largest annual increase in active listings were: Denver (+87.0 percent), Columbus, Ohio (+59.3 percent), San Jose, California (+47.6 percent), Seattle, Washington (+27.6 percent), and Washington, D.C. (+24.0 percent) — some of the most expensive cities in the country.
What does this mean for affordability?
Potential homeowners can still take heart. The recent inventory increase and the slowdown in price appreciation is not a coincidence and may be signaling good news for those considering buying a home.
House prices are in part a reflection of supply and demand. As housing supply increases relative to demand, price appreciation slows down.
In addition, rising prices and modestly increasing mortgage rates have reduced affordability, particularly for the first-time buyer struggling to find something to buy with so little for sale.
Some homebuyers, specifically first-time millennial home buyers, are getting discouraged and may be temporarily “boycotting” the market. Just as increased supply reduces price appreciation, so does reduced demand.
All of these factors indicate that the seller’s market may be coming to an end. As more inventory enters the market, buyers have more options, bidding wars are less likely and sellers start reducing listing prices. It’s been six years since the end of the last one, but the rare buyer’s market may be in the housing market’s future.