California Home Sales down 36% YoY in April, Median Prices Down 7.8% YoY
CALCULATEDRISK By Bill McBride
Each month I track closed sales, new listings and active inventory in a sample of local markets around the country (about 40 local housing markets) in the US to get an early sense of changes in the housing market.
After the National Association of Realtors® (NAR) releases the monthly existing home sales report, I pick up additional local market data that is reported after the NAR (and I’m frequently adding more markets). This is the final look at local markets in April.
The big story for April existing home sales was the large year-over-year (YoY) decline in sales. Also, active inventory increased YoY, but is still historically low – and new listings were down sharply YoY.
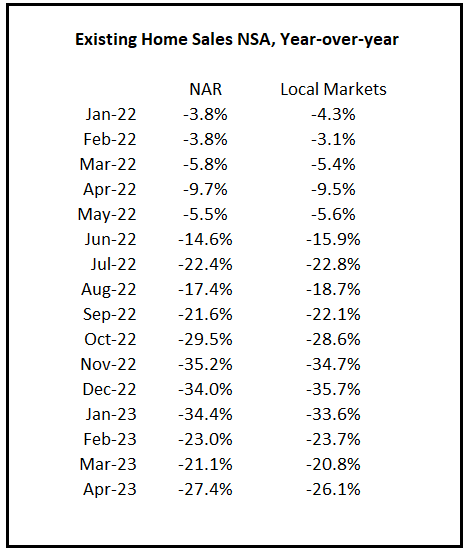
First, here is a table comparing the year-over-year Not Seasonally Adjusted (NSA) declines in sales since January 2022 from the National Association of Realtors® (NAR) with the local markets I track. So far, these measures have tracked pretty well. The NAR reported sales were down 27.4%% NSA YoY in April.

California Home Sales Down 36.1% YoY in April, Median Prices Decline 7.8% YoY
California doesn’t report sales NSA and inventory numbers, but they do report sales seasonally adjusted. Note that in March, sales were down 37.8% YoY, so sales didn’t decline as much April as in March..
Here is the press release from the California Association of Realtors® (C.A.R.): Higher mortgage rates and low housing inventory restrain California home sales in April, C.A.R. reports
• Existing, single-family home sales totaled 267,880 in April on a seasonally adjusted annualized rate, down 4.7 percent from March and down 36.1 percent from April 2022.
• April’s statewide median home price was $815,340, up 3.0 percent from March and down 7.8 percent from April 2022.
…
Closed escrow sales of existing, single-family detached homes in California totaled a seasonally adjusted annualized rate of 267,880 in April, according to information collected by C.A.R. from more than 90 local REALTOR® associations and MLSs statewide. The statewide annualized sales figure represents what would be the total number of homes sold during 2023 if sales maintained the April pace throughout the year. It is adjusted to account for seasonal factors that typically influence home sales.April’s sales pace was down 4.7 percent on a monthly basis from 281,050 in March and down 36.1 percent from a year ago, when a revised 418,970 homes were sold on an annualized basis. Sales of existing single-family homes in California remained below the 300,000-unit pace for the seventh consecutive month.
…
“Home sales remained soft as the lock-in effect continued to tighten housing supply and keep would-be sellers from listing their homes for sale, which contributed to a 30 percent year-over-year drop in new statewide active listings ― the largest drop since May 2020 when the pandemic shutdown took place,” said C.A.R. Senior Vice President and Chief Economist Jordan Levine. “A surge in borrowing costs as mortgage rates surpassed 7% in late February and early March also contributed to the market weakness, as many transactions that opened in those two months were closed in April.”emphasis added
Active Inventory in April
Here is a summary of active listings for these early reporting housing markets in April.
Inventory in these markets were up 38% YoY in March andare now up 21% YoY. It is possible that inventory will be down YoY in June or July!
Notes for all tables:
- New additions to table in BOLD.
- Northwest (Seattle), Santa Clara (San Jose), Jacksonville, Source: Northeast Florida Association of REALTORS®
- Totals do not include Atlanta, Denver or Minneapolis (included in state totals)
New Listings in April
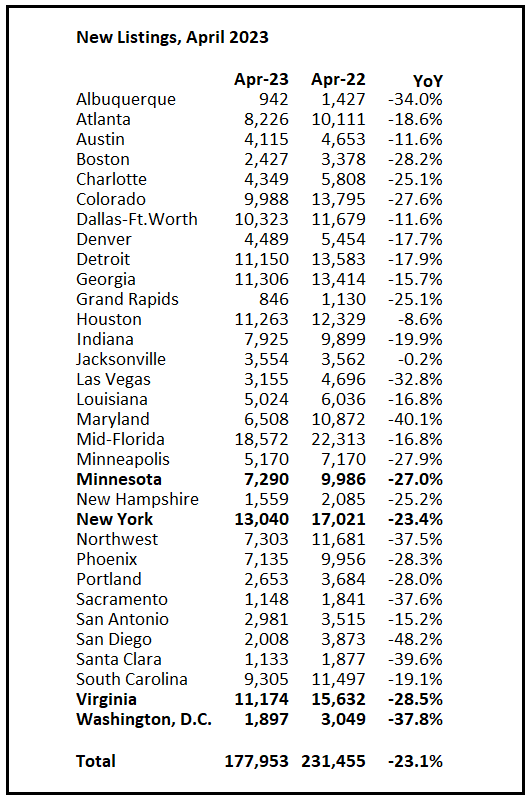
And here is a table for new listings in April (some areas don’t report new listings). For these areas, new listings were down 23.1% YoY. Potential sellers that are locked into their current homes with low mortgage rates has pushed down new listings.
Last month, new listings in these markets were down 17.1% YoY. The decline in new listing in April – for these areas – was more than the YoY decline in March.

Closed Sales in April
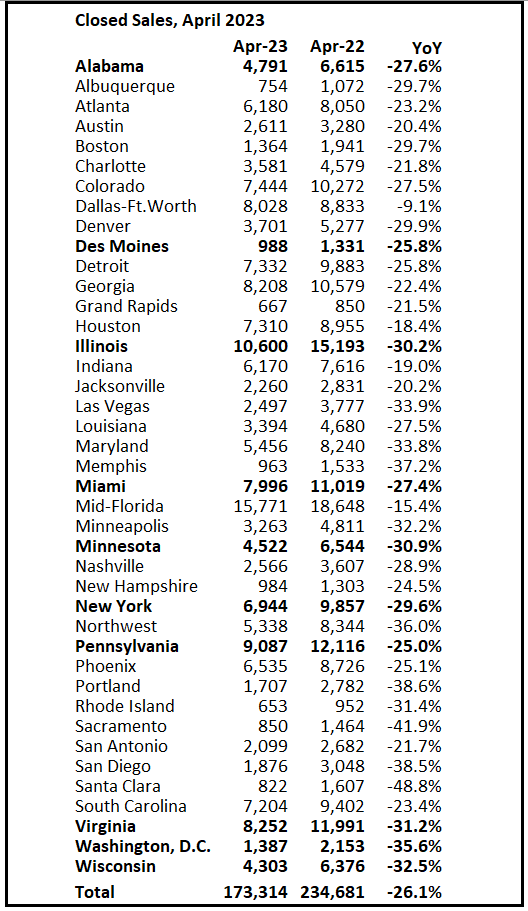
And a table of April sales.
In April, sales in these markets were down 26.1%. In March, these same markets were down 20.5% YoY Not Seasonally Adjusted (NSA).
This was a larger YoY decline NSA in April than in March for these markets, however there was one less selling day in April this year.

Note: Even if existing home sales activity bottomed in December (4.03 million SA) and January (4.00 million SA), there are usually two bottoms for housing – the first for activity and the second for prices. See Has Housing “Bottomed”?
My early expectation is we will see a somewhat similar level of sales in May as in April. 30-year mortgage rates averaged about 6.4% in February and March (for closed sales in April), and 30-year rates averaged 6.44% in March and April (about the same).
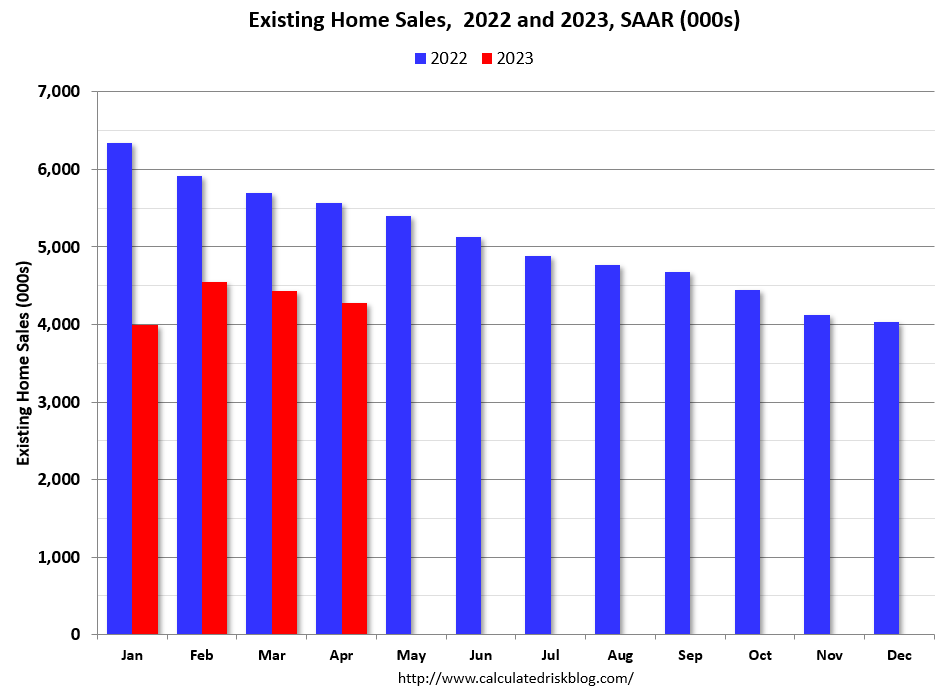
The NSA decline will be less in May than in April for two reasons: 1) there were the same number of selling days in May 2022 as in May 2023, and 2) sales were declining last year, and the YoY decline will likely be less. This graph shows existing home sales by month for 2022 and 2023.

Since sales were declining every month last year, seasonally adjusted, the YoY decline will be less as the year progresses – and sales might even be up YoY at the end of 2023.
