RIS Media
19 February 2014
The latest FNC Residential Price Index™ (RPI) shows U.S. home prices continue to rise. As of December, the RPI indicates the fastest year-over-year growth since the recovery began in early 2012. The index, constructed to gauge price movement among normal home sales exclusive of distressed properties, was up 0.3% in December—outperforming the overall price movement in the single-family housing market. Unlike overall price measures that include distressed sales (which recently have shown signs of weakening), home prices of normal sales have been rising at steady and sustainable levels—about 0.3-0.5% per month.
FNC’s RPI is the mortgage industry’s first hedonic price index built on a comprehensive database that blends public records of home prices with real-time appraisals of property and neighborhood attributes. As a gauge of underlying home values, the RPI excludes final sales of real-estate owned (REO) and foreclosed homes, which are frequently sold with large price discounts, likely reflecting poor property conditions.
Based on recorded sales of normal, non-distressed properties (existing and new homes) in the 100 largest metropolitan areas, the FNC national composite index shows that, in December, home prices rose at a seasonally unadjusted rate of 0.3%, essentially maintaining the same pace achieved since September. On a quarterly basis, home prices were up 1.3% in the fourth quarter. In the nation’s top housing markets, the two narrower indices (30- and 10-MSA composites) show a similar steady rise. The indices’ year-over-year trends show that, as of December 2013, annual home price appreciation has reached 8.7%—a pace last observed in June 2006 when home prices peaked.
The chart below shows the latest price trends in each MSA in the FNC Comp 30. Miami, Riverside (CA), Phoenix, Nashville, and Sacramento show the largest price increase in December at 1.7%, 1.6%, 1.5%, 1.5%, and 1.3%, respectively. Riverside and Miami in particular have realized rapid price accelerations in recent months, each rising 5.7% between the third and fourth quarters, followed by Orlando, San Francisco, and Las Vegas at 3.9%, 3.9%, and 3.8%, respectively. Despite continued gains, home prices in Phoenix have tapered off considerably: up a small 1.8% in the fourth quarter compared to 4.3% in the third and 6.0% in the second quarter, reflecting weakening demand from investors as the supply of distressed homes is waning. More than a third of the metro areas show December price weakening, led by Cincinnati at 1.5%.
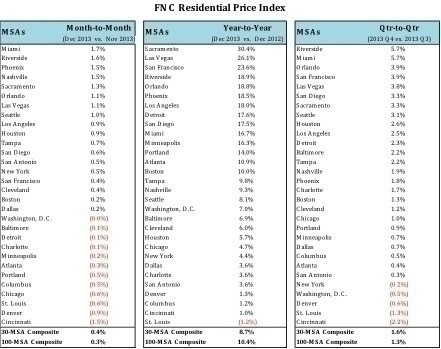
The majority of the individual markets tracked by the FNC RPI show that home prices end the year with the largest year-over-year growth since the start of the housing recovery. Sacramento, in particular, has recently experienced the fastest price growth in the country, where home prices surged more than 30% on a year-over-year basis when compared to December 2012—outperforming Las Vegas and Phoenix where momentum seems to have plateaued.
1 The hedonic procedures used to create the index are described in “Hedonic versus repeat-sales housing price indexes for measuring the recent boom-bust cycle,” by Dorsey, R.E., Hu, H., Mayer, W.J., and Wang, H.C., Journal of Housing Economics 19 (2), 75–93.
2 The FNC National Residential Price Index is a volume-weighted aggregate price index consisting of 100 major metropolitan areas across different regions of the U.S. All FNC Residential Price Indices are constructed to capture unsmoothed home price trends.