Inman News
24 April 2018
Home prices are up 6.3 percent from last year and 0.4 percent over January, according to the latest numbers from the S&P CoreLogic Case-Shiller National Home Price NSA Index.
Home prices across the country are continuing a rise akin to the 15 years leading up to the 2008 financial crisis, according to the latest S&P CoreLogic Case-Shiller National Home Price NSA Index.
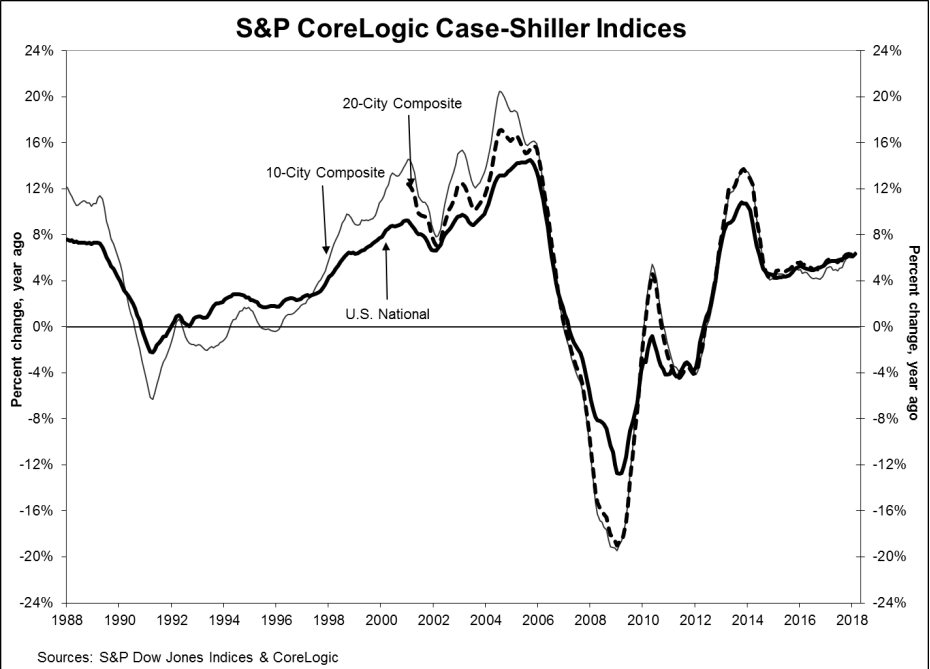
The index reported a 6.3 percent year-over-year gain in February 2018 and a 0.4 percent month-over-month gain — the latest month for which figures are available. David Blitzer, managing director and chairman of the index committee at S&P Dow Jones Indices said strong employment numbers and economic conditions will likely lead to a continued run of increases.
“Year-over-year prices measured by the national index have increased continuously for the past 70 months, since May 2012,” he said. “Over that time, the price increases averaged 6 percent per year.”
“This run, which is still ongoing, compares to the previous long run from January 1992 to February 2007, 182 months, when prices averaged 6.1 percent annually,” he added. “With expectations for continued economic growth and further employment gains, the current run of rising prices is likely to continue.”
Despite the rise following a similar trend to the decade-and-a-half before the financial crisis, Blitz has said in the past he doesn’t believe we’re seeing déjà vu, due to the price increases varying across the country and the lower numbers of homes being sold.
Cities with the strongest employment gains typically saw the largest rise in home prices, while cities on the lower end of the gain spectrum saw a smaller rise in home prices, according to the report.
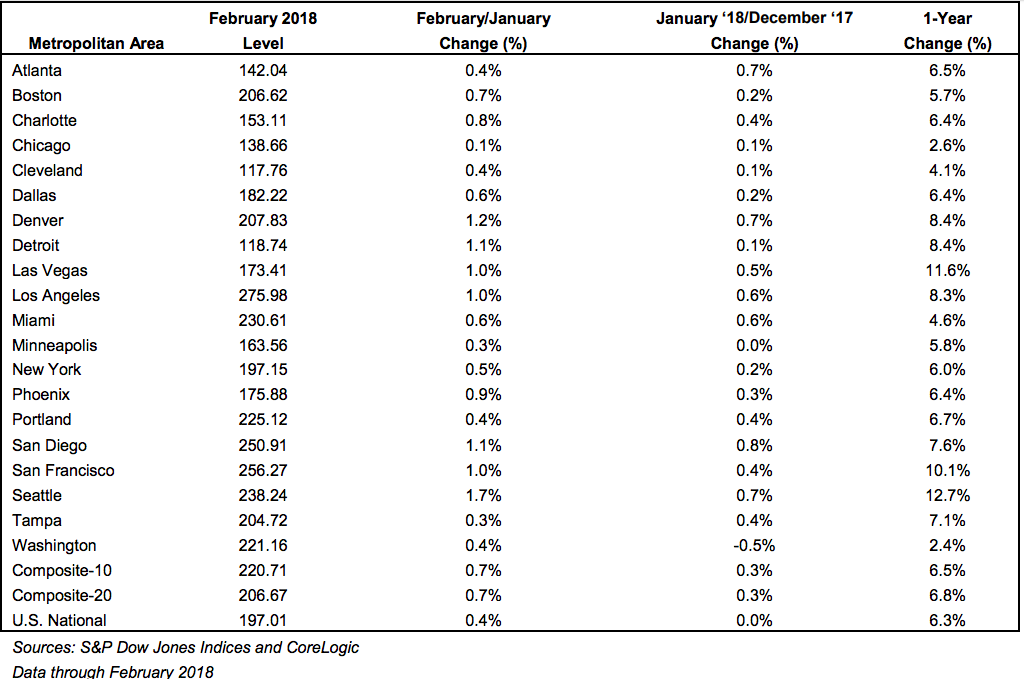
“Among the 20 cities covered by the S&P CoreLogic Case-Shiller Indices, Seattle enjoyed both the largest gain in employment and in home prices over the 12 months ending in February 2018,” Blitz said. “At the other end of the scale, Chicago was ranked 19th in both home price and employment gains; Cleveland ranked 18th in home prices and 20th in employment increases.”
There are a few outliers. Both San Francisco and Los Angeles saw home price gains rank much higher than would be expected from their employment increases, which shows that prices in California are rising much higher than expected, according to Blitz. Conversely, Miami home prices experienced smaller home price increases with better-than-average employment gains.
Seattle’s 12.7 percent year-over-year price increase led the way, followed by Las Vegas at 11 .6 percent and San Francisco at 10.1 percent. In total, 13 of 20 cities analyzed by the index reported greater price increases for the year ending in February 2018 versus January 2018.
Lawrence Yun, the chief economist of the National Association of Realtors believes that way one way to slow the steady price rise is to build more homes, particularly smaller sized entry-level homes and condominiums.
“There is no let-up to rising home prices,” said Yun. “The Case-Shiller Index and National Association of Realtors median home price both show gains of roughly double the average wage growth. Even as the tightening job market is starting to boost incomes, those looking to buy are facing a double whammy of fast rising home prices and higher mortgage rates.”
About the Index
The S&P/Case-Shiller U.S. National Home Price Index is a composite of single-family home price indices that is calculated every month; the indices for the nine U.S. Census divisions are calculated using estimates of the aggregate value of single-family housing stock for the time period in question.
The nine divisions are:
- New England
- Middle Atlantic
- East North Central
- West North Central
- South Atlantic
- East South Central
- West South Central
- Mountain
- Pacific
CoreLogic serves as the calculation agent for the S&P/Case-Shiller U.S. National Home Price Index.