Inman News
Housing inventory across the US was down 27.4% year over year, or approximately 363,000 fewer homes during the same period last year, according to realtor.com.
Although buyers appear to have regained confidence in June, sellers are lagging behind.
New listings continue to slump by 17 to 21 percent compared to June 2019, according to realtor.com’s June Monthly Housing Trends report.
Housing inventory across the U.S. was down 27.4 percent year over year in June, or approximately 363,000 fewer homes, during the same period last year. Although the national volume of new listings, which was down by about 19.3 percent from last year, was an improvement from annual declines of 44.1 percent in April and 29.4 percent in May, April and May new listings continued to increase weekly while new listings remained at a constant rate of decline in June.
“Our June data reinforces that buyers are out in force and serious about finding a home,” Danielle Hale, chief economist at realtor.com, said in a statement. “Although the new listings trend has improved, inventory continues to decline, indicating that what is coming onto the market is selling. The housing market has certainly demonstrated its resilience during the COVID pandemic, but conditions vary market by market.”
Overall, the 50 largest metro areas in the country have showed a faster recovery than other areas. Total inventory in the largest metros dropped by 26.5 percent year-over-year in June compared to 27.4 percent across the nation. New listings in these metros were also only down by 16.2 percent year-over-year compared to the national decline of 19.3 percent. The average home in these metros was on the market for 53 days, six days more than last year, but 19 days less than the rest of the country. Listing prices in these metros also increased by an average of 5.7 percent year-over-year, up from the 3.3 percent year-over-year gain in May, and slightly more than the national increase of 5.1 percent year-over-year.
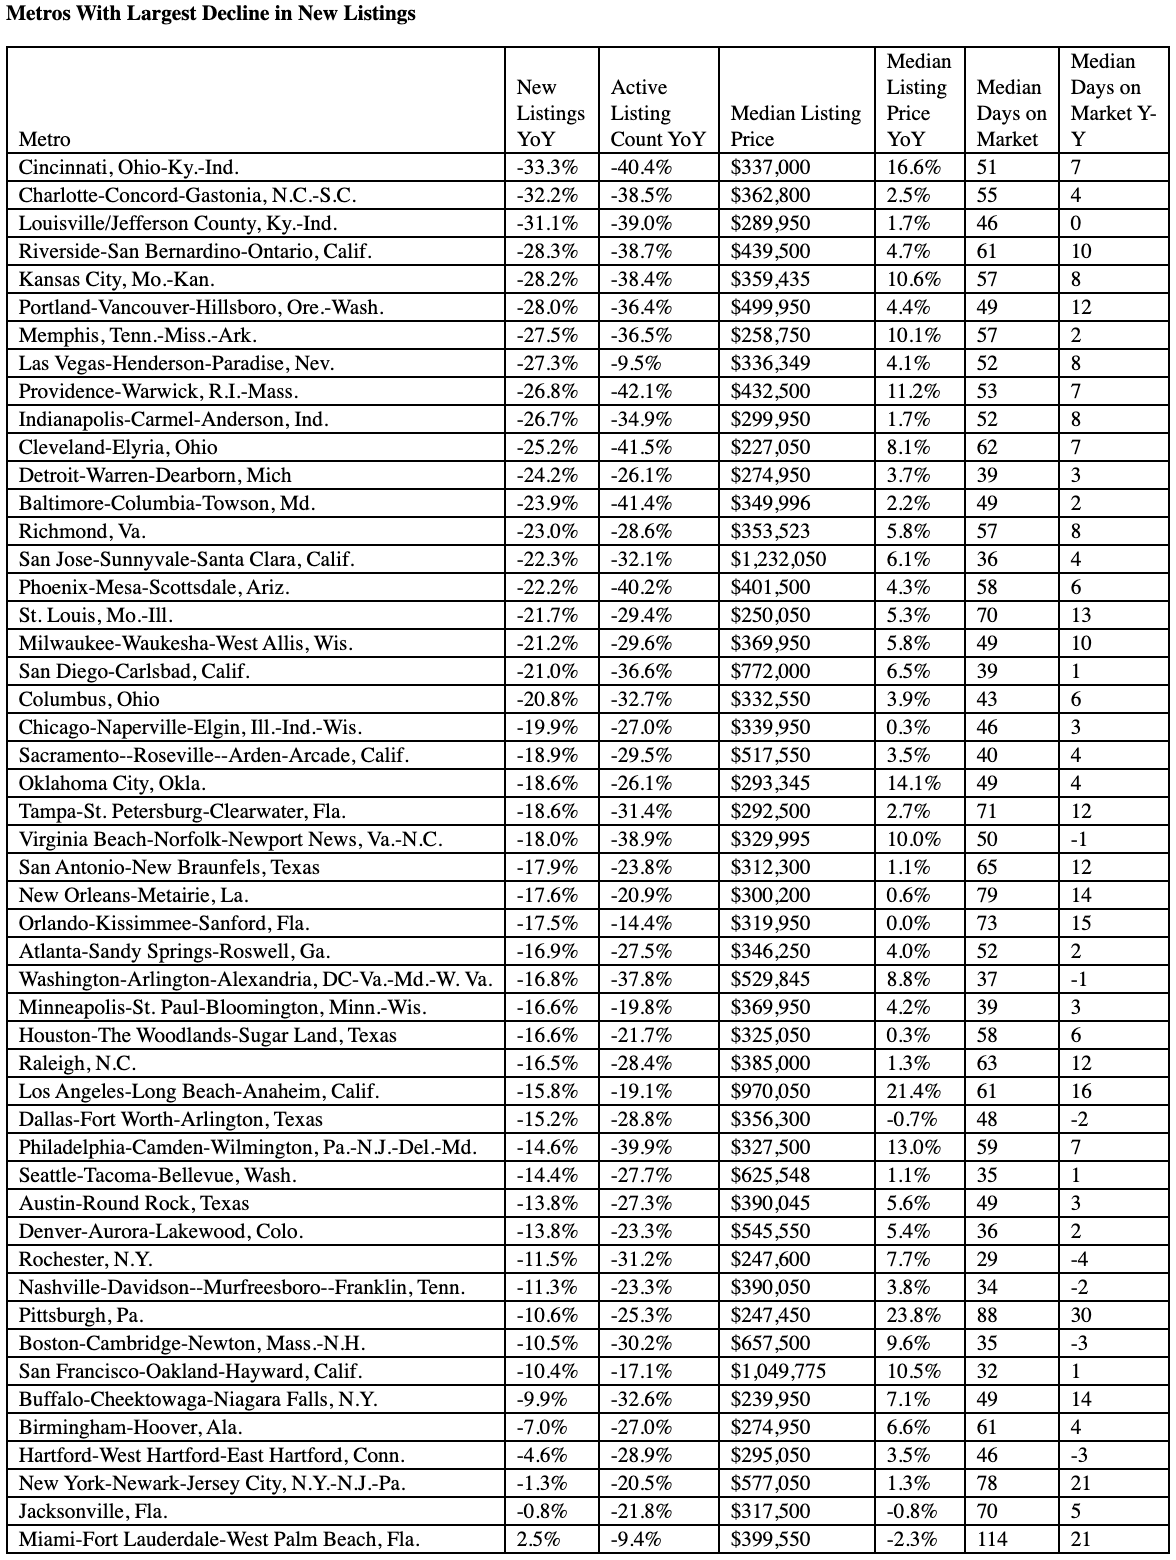
Courtesy of realtor.com
The majority of large metros (47 out of 50) saw greater inventory declines in June than the month before, even though most markets also saw an improvement in the year-over-year decline in newly listed properties, “an indication that homes are coming onto the market and selling,” realtor.com’s report states.
Nationwide, the average home spent 72 days on market in June, an increase of 15 days year-over-year. Still, some markets did see days on market decrease year-over-year, including Rochester, New York (-4 days); Hartford-West Hartford-East Hartford, Connecticut (-3 days); and Boston-Cambridge-Newton, Massachusetts-New Hampshire (-3 days).
Pittsburgh saw the largest increase in days on market, with an increase of 30 days year-over-year. However, the metro also saw the largest year-over-year increase in median listing price, which rose by 23.8 percent. Markets that saw the steepest price declines were all by less than 3 percent, including in Miami-Fort Lauderdale-West Palm Beach, Florida (-2.3 percent); Jacksonville, Florida (-0.8 percent); and Dallas-Fort Worth-Arlington, Texas (-0.7 percent).