Inman News
14.8% annual home price growth is the highest seen in Black Knight data going back nearly 30 years.
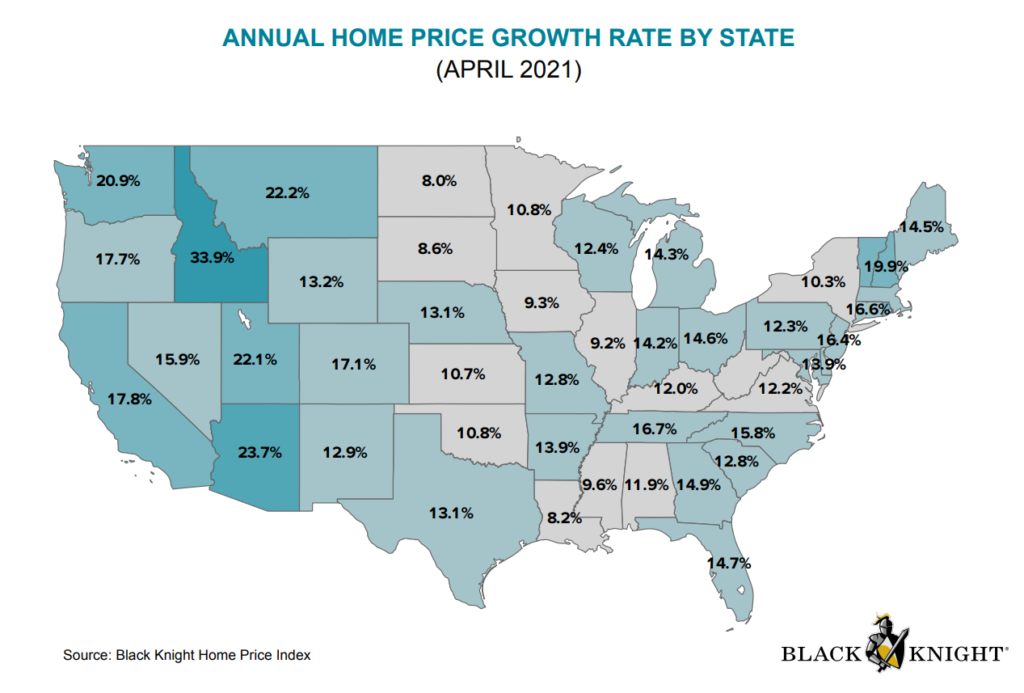
With listings shortages persisting, U.S. housing markets remained “white hot” in April, with home prices growing at a record — and unsustainable — annual rate of 14.8 percent.
Black Knight’s latest Mortgage Monitor Report recorded “the highest annual home price growth rate we’ve ever seen” in records going back nearly 30 years, said Ben Graboske, the company’s data and analytics president, in a statement.
Western states saw the biggest price gains, with six metro markets — Austin, Texas; Phoenix, Arizona; Seattle, Washington; Riverside, Sacramento and San Diego, California — growing at an annual rate of 20 percent or more.
“Current levels of home price growth aren’t sustainable for an extended period, especially if mortgage rates begin to rise,” Black Knight analysts concluded in the report.
If home values keep climbing at the current pace, and mortgage rates go up, that will push a key measure of affordability, the payment-to-income ratio, above the 23.6 percent average over the last 25 years. Anything above the current ratio of 20.5 percent is considered a “tipping point” where home price appreciation typically slows, Graboske said.
If rates on 30-year fixed-rate loans rise to 3.5 percent by the end of 2022, the national payment-to-income ratio would hit 21.6 percent by the end of this year, and 25 percent by 2022.
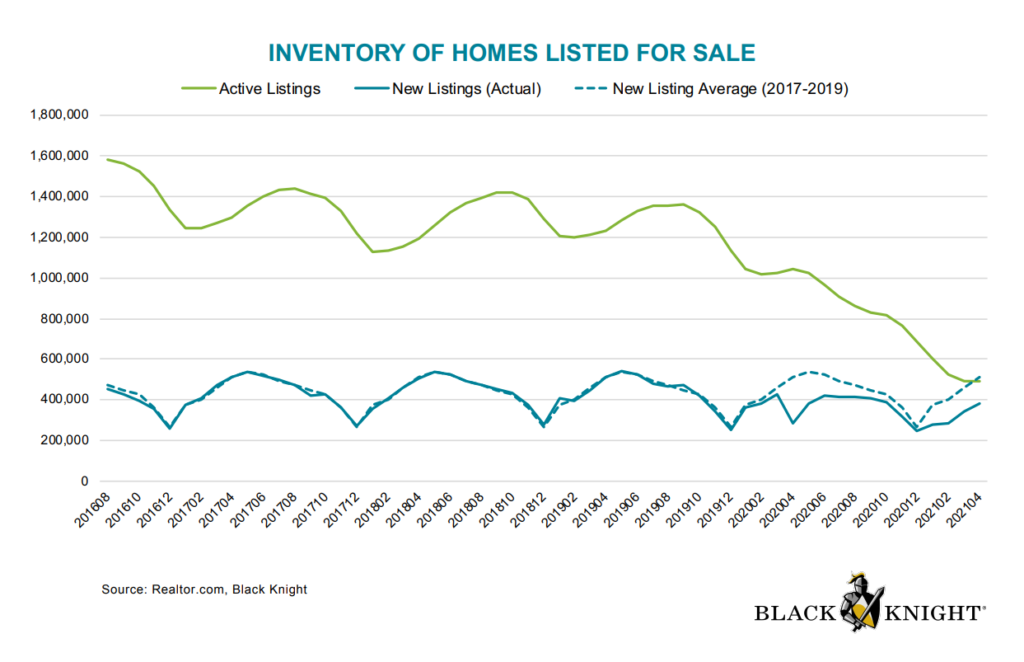
Low mortgage rates are fueling demand for housing, but Graboske said the more acute driver of price increases is the shortage of available listings.
“The total number of active listings was down 60 percent from the 2017 to 2019 average for April,” Graboske said. That means there were close to 750,000 fewer homes on the market than is typical. “It’s not getting any better, either.”
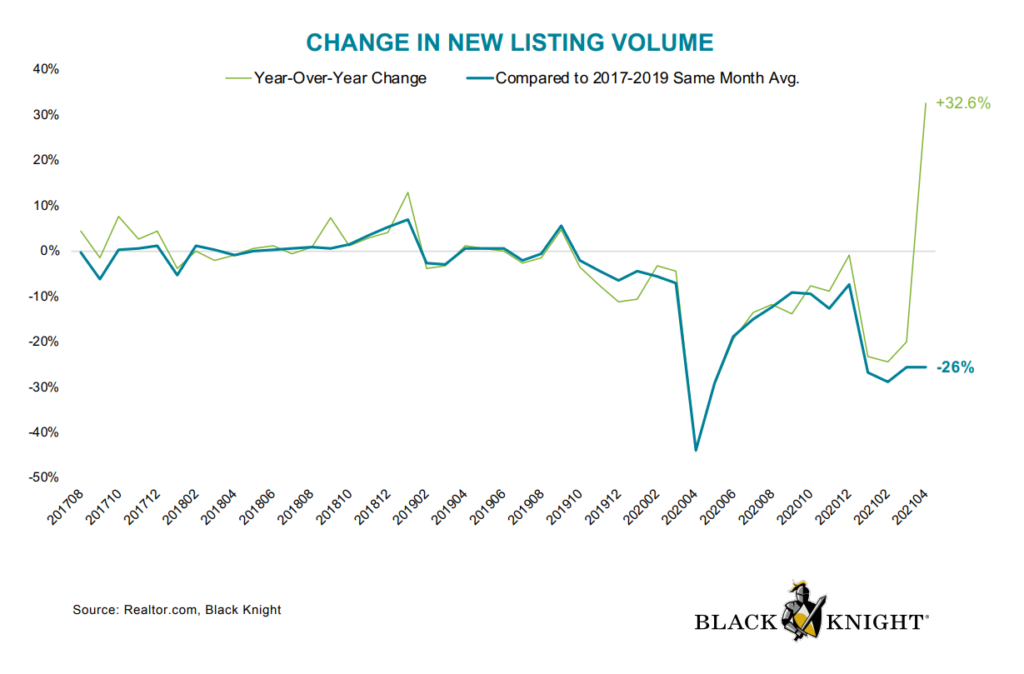
Compared to pre-pandemic seasonal levels, there were 26 percent fewer newly listed properties in April. With homes selling so quickly, newly listed properties now account for more than 75 percent of listings, compared to 27 percent a year ago.
The drop in new listing volume is likely to “create noticeable headwinds for both purchase lending and existing home sale volumes in coming months,” the report said.
At the metro level, even the slowest-growing markets are seeing “aggressive” price growth, the report noted. At 8.1 percent, Pittsburgh, Pennsylvania, had the lowest home price growth rate among the 50 largest markets.
But that’s the highest “floor” Black Knight has ever seen — more than three times as high as previous high of 2.4 percent.
The top 10 metro markets with the strongest price appreciation were:
- Austin, Texas (24.9 percent)
- Phoenix, Arizona (24.4 percent)
- Riverside, California (22.3 percent)
- Seattle, Washington (20.8 percent)
- Sacramento, California (20.8 percent)
- San Diego, California (20.1 percent)
- Salt Lake City, Utah (19.9 percent)
- Providence, Rhode Island (18.1 percent)
- Tampa, Florida (17.3 percent)
- Jacksonville, Florida (17.0 percent)
Among the 50 largest housing markets, the 10 markets with the weakest price appreciation were:
- St. Louis, Missouri (11.6 percent)
- San Antonio, Texas (11.6 percent)
- Orlando, Florida (11.0 percent)
- New Orleans, Louisiana (10.9 percent)
- Minneapolis, Minnesota (10.8 percent)
- Birmingham, Alabama (10.8 percent)
- Houston, Texas (10.3 percent)
- Oklahoma City, Oklahoma (10.0 percent)
- Chicago, Illinois (9.9 percent)
- Pittsburgh, Pennsylvania (8.1 percent)
Many would-be homebuyers have seen the headlines about rising home prices and shortages of listings in many markets. More than half (56 percent) think it’s a bad time to buy, according to a recent Fannie Mae survey. The survey also found that while would-be homebuyers know it’s tough out there, an all-time high share of consumers (72 percent) said they’d buy a home if they moved.