HousingWire
Q&A: The state of the housing market.
HW: What’s the number one question you are getting from the real estate agent community on the economy and housing market?
Logan Mohtashami: The common questions are as follows:
- Are we going into a recession economy question, which I always refer to as my six-flag recession economic model?
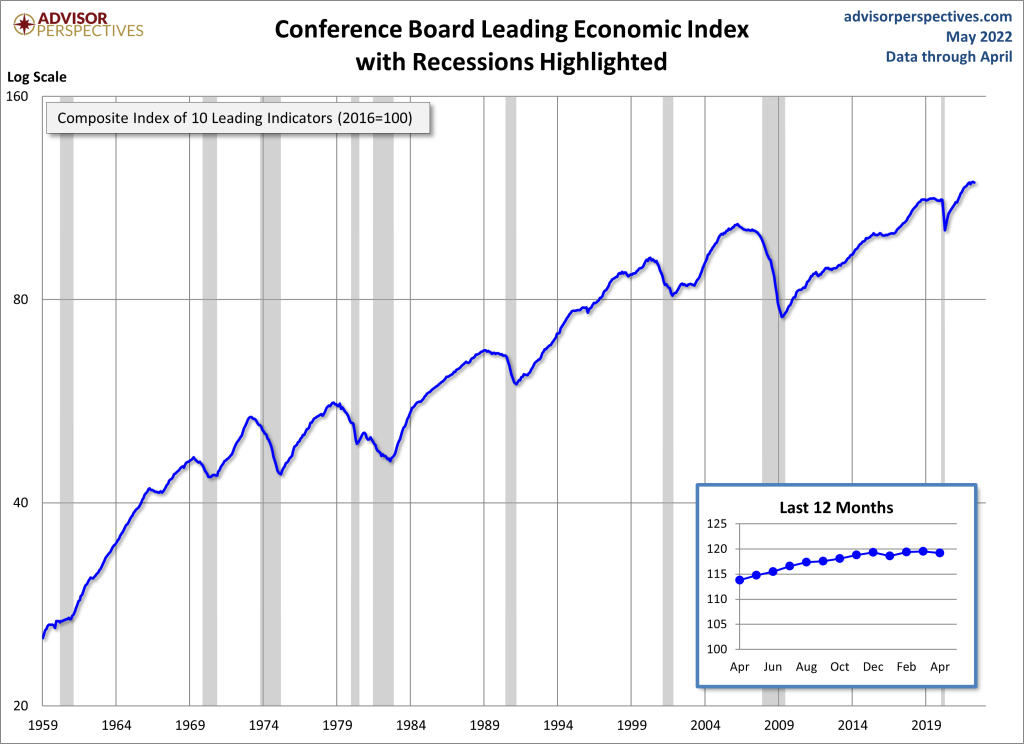
We have four flags raised so far; the last two are always the most important in a historical context. I have not raised either yet. The Leading Economic Index hasn’t fallen yet.
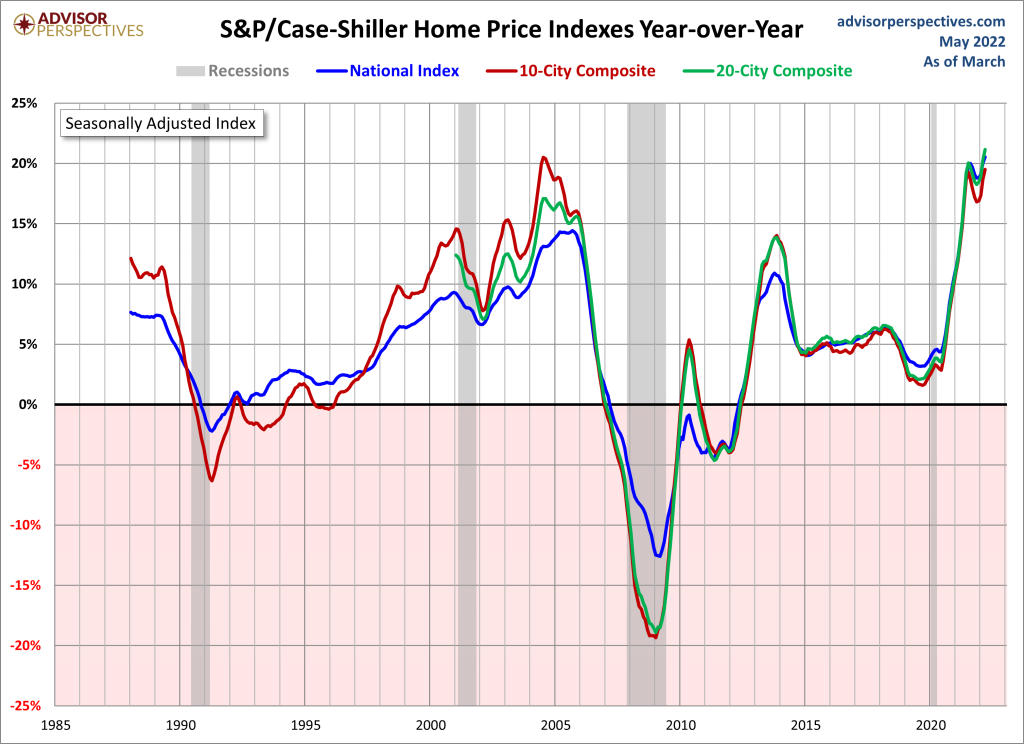
- The number one question I get on housing is the same question I get always: when are home prices going to fall?
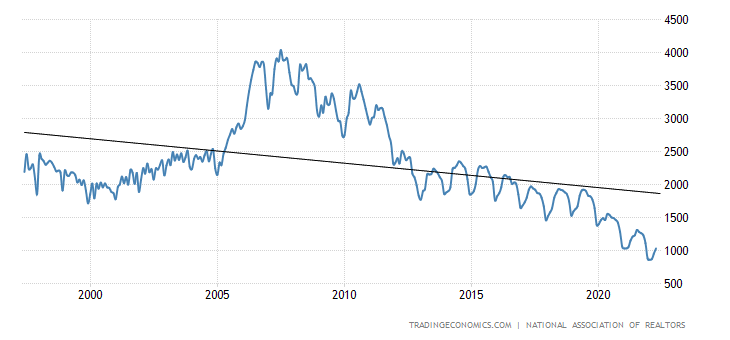
I always try to focus people on the total inventory data until we get inventory back into a range of 1.52-1.93 million; we are still in a savagely unhealthy housing market because the price growth we have seen since 2020 has more to do with supply than demand.
HousingWire: To add to that, since housing is in an inventory shortage, the market has changed, so the good news is inventory is growing. What levels should we be hoping for?
Logan Mohtashami: Regarding inventory, we had a slow train wreck happening for years, and I can explain in more detail. Since 2014 inventory has been falling slowly for years, then here come years 2020-2024, our most prominent housing demographic patch ever in history with low mortgage rates.
So any uptick in demand can break us under 1.52 million. Once we get below this level, it creates forced bidding action. You don’t want to see involuntary bidding action for shelter because it eats into affordability so much.
So we can see what happened. Unlike the housing bubble years, where credit pushed home prices with demand, we just had a raw inventory shortage with demand picking up for sure, but nothing like we saw from 2002-to 2005. Then this happened.
I have kept with my same premise post-2020, we would like to see inventory get back into a range of 1.52-1.93 million; that market will provide enough homes so the days on the market will grow and give people choices and cool down price growth. As we can see, it’s been a struggle to get inventory back into this range post-2020.
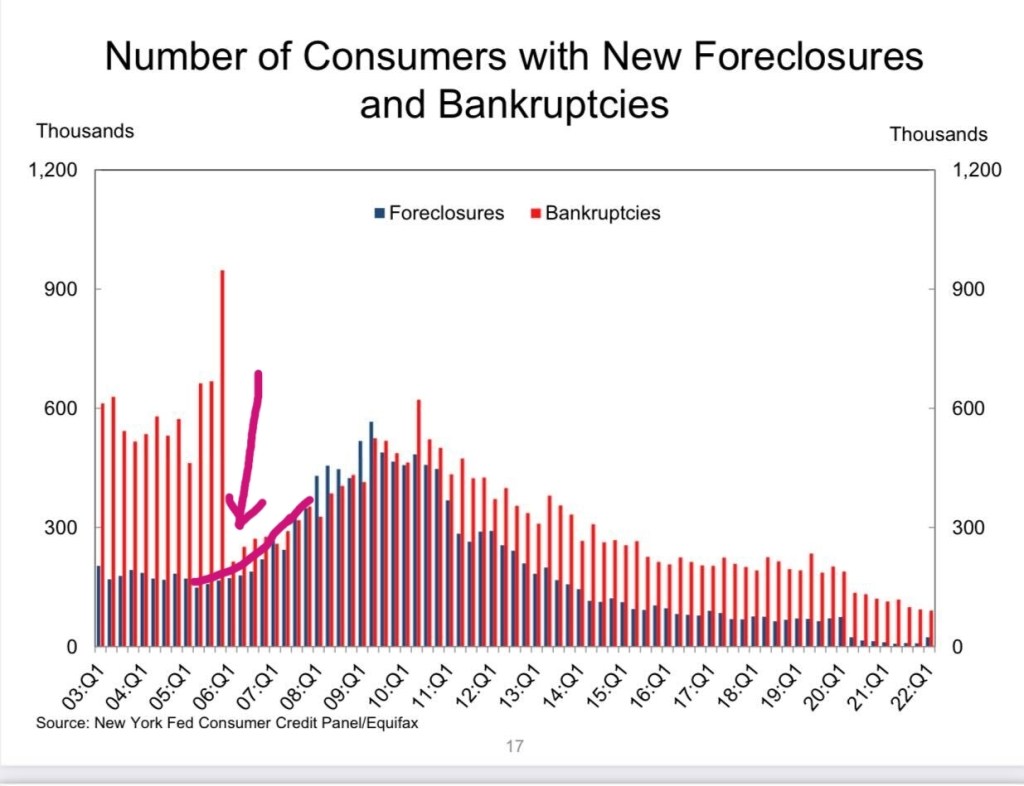
The big difference now than, let’s say, what we saw from 2002-2008. We will not know the credit forced selling of inventory like we saw back debt because credit profiles look much better now.
HW: When (if at all) do you think the next recession flag will be raised? Can you recap the flags real quick too?
Logan Mohtashami: 6 Recession flags are (Four that are raised):
- The unemployment rate got to 4%; this is a progression red flag, meaning the economic expansion is more mature.
- The Federal Reserve starts to raise rates, another progression red flag; expansion is more mature.
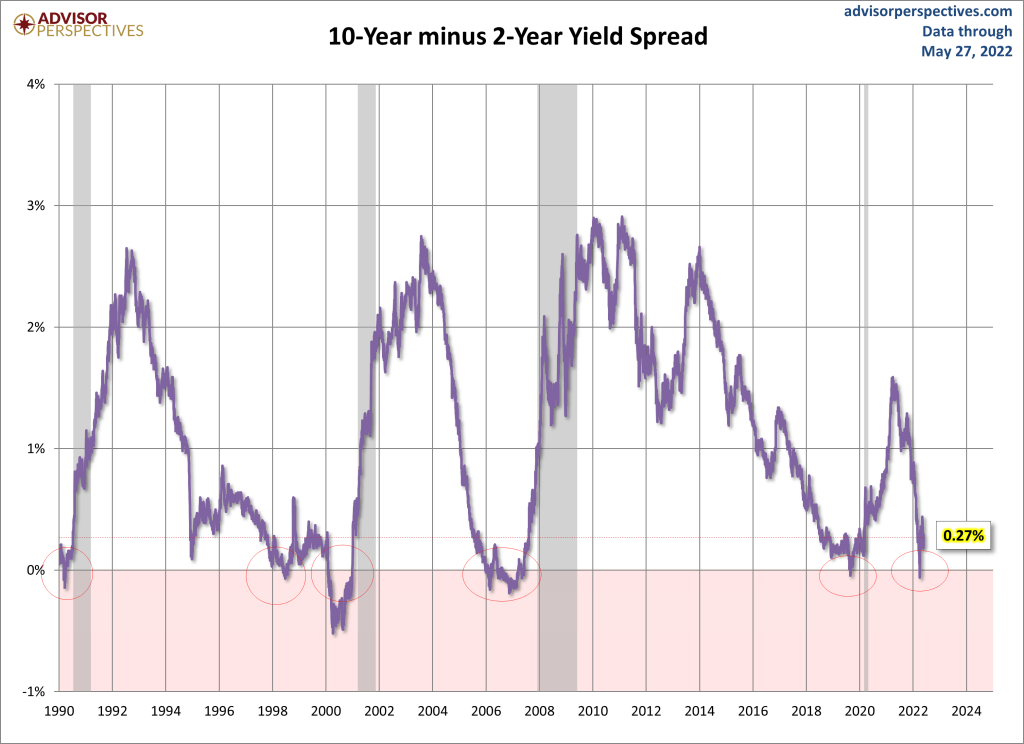
- The Inverted Yield Curve, This is more of a market drive bond yield red flag; I had been on an inverted yield curve watch since Thanksgiving of 2021. This is why the 2-year yield and 10-year yield slap high fives and say hi to each other: another progression red flag, the more mature stage of the economy. As you can see below, when yields are inverted, a recession isn’t that far off. It’s a bit more complicated than that for me, but I won’t bore you with my nerdy takes here
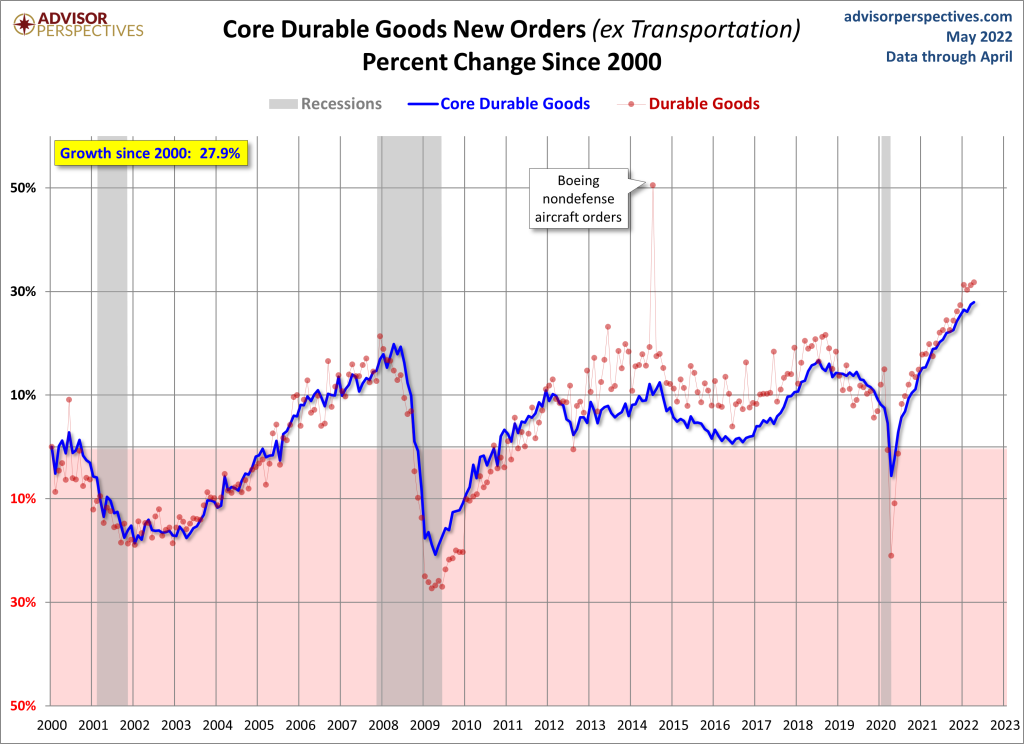
- This Red Flag is more critical to the economic cycle itself. We want to find the sector of the economy that is overheating where there is going to be a demand collapse and too much inventory. This is a reason why a company will lay off people. I use Peloton as my company example for this. Booming demand, collapse in demand, laid off a significant % of workers already. In this recovery, the Durable Good buying is off the charts, so that sector will cool down, and service sector spending will rise.
Recession flag 5 and 6:
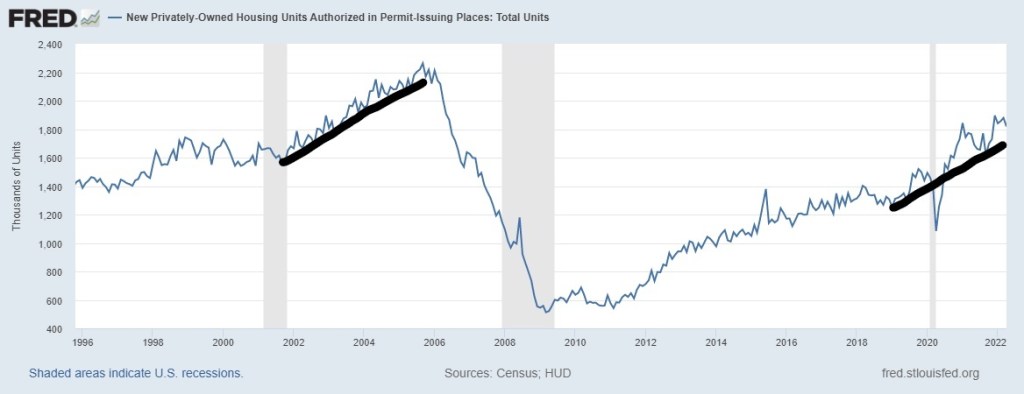
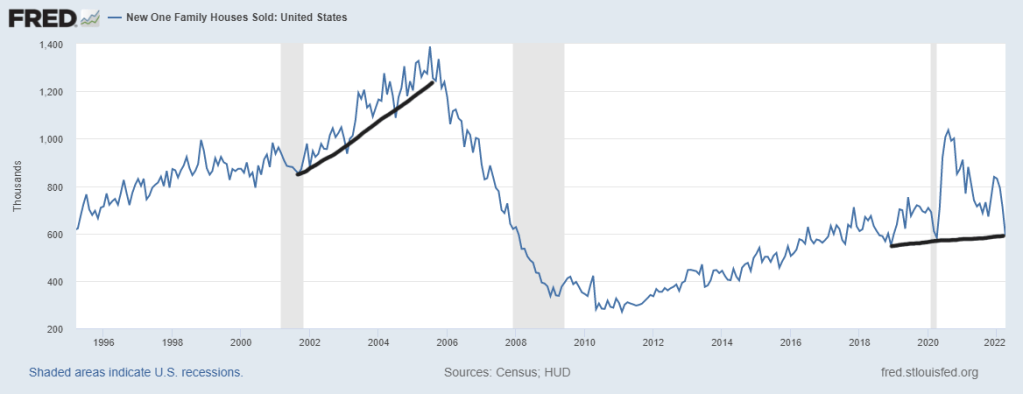
- Leading economic index falls 4-6 months into a recession; the chart is above. Also, housing starts, permits, and new home sales typically fall into a recession. We are not there yet on either two.
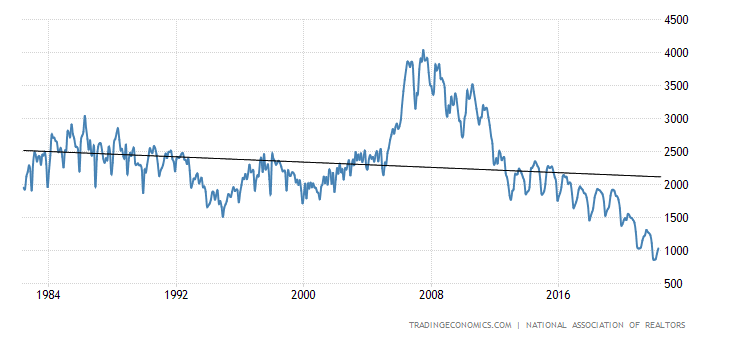
The new home sales sector is vital to know; it has had a massive spike in supply recently 9.0 months.
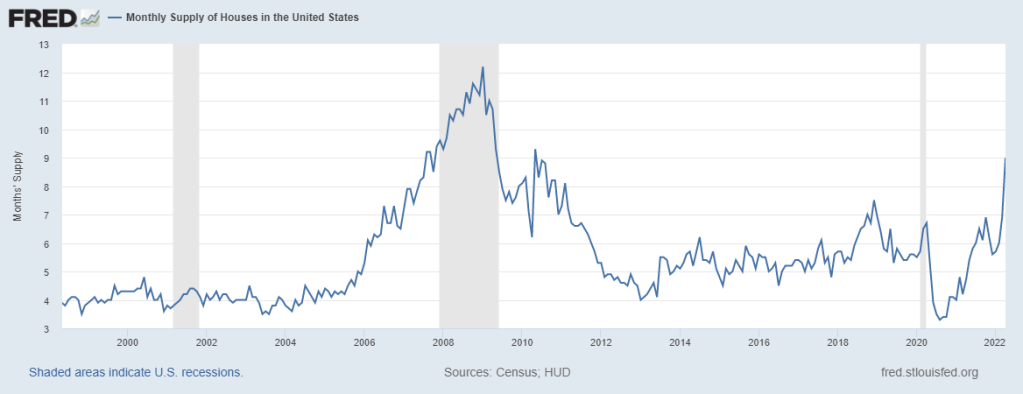
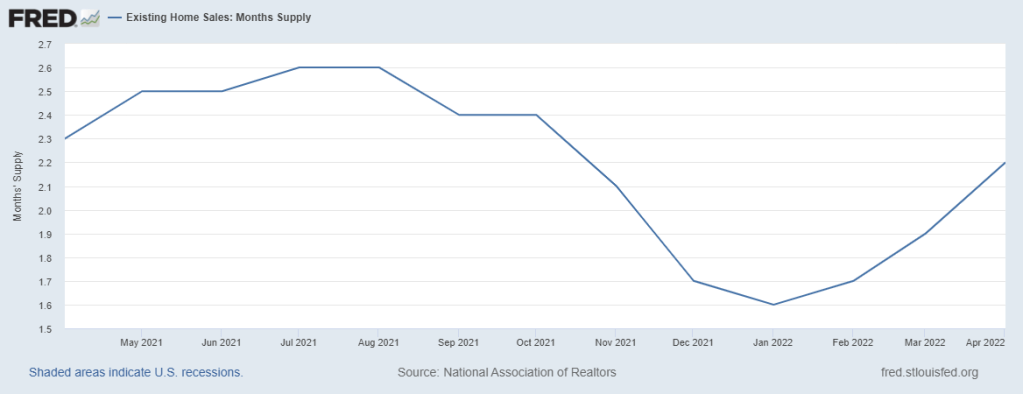
Many people look at this chart and think it’s for the existing home sales market; it isn’t. Stock traders have made this mistake for many years. The existing home monthly supply is 2.2 months.
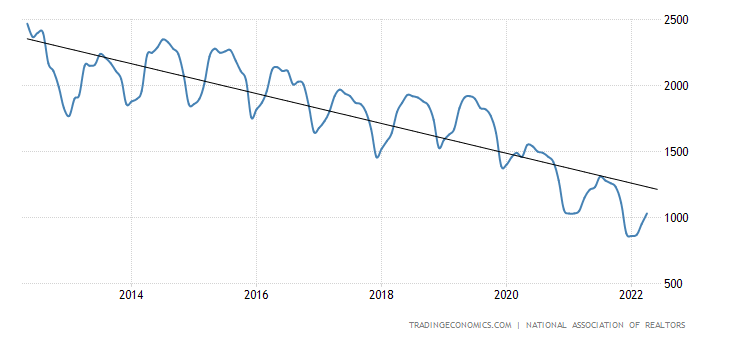
However, out of that nine months of supply for new homes:
- 6.0 of that are homes that haven’t started to build yet. Ghost Supply
- 2.2 Months are homes under construction
- 0.8 months are completed new homes
So, the data needs context. While the new home sales sector is getting hit with higher rates, their inventory channels are much different than the supply levels of 2005-2011. Also, context is critical, we never had a credit boom in demand, so we can’t have a credit bust. The last new home sales data shows we are only at 1996 levels today.
Logan Mohtashami, Lead Analyst for HousingWire, is a housing data analyst, financial writer and blogger covering the U.S. economy, specializing in the housing market. Mohtashami’s work is frequently quoted in BankRate.com and Bloomberg financial. He has been an invited speaker at the Americatlyst, California Association Of Realtors, and other economic conferences.