World Property Journal
2 June 2015
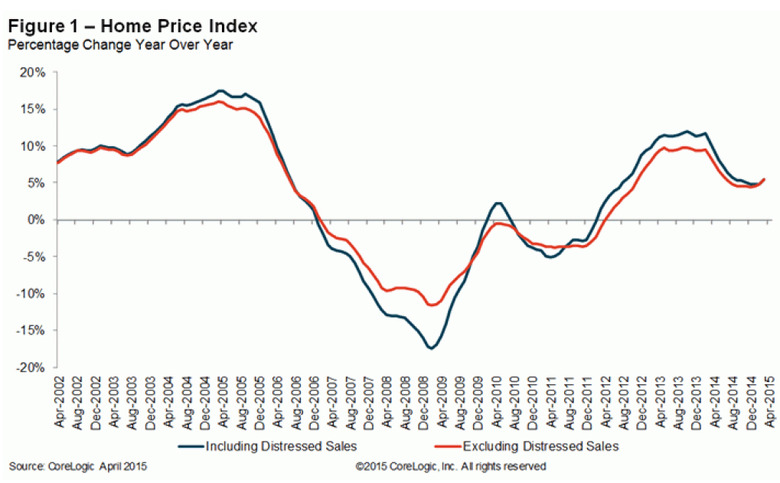
According to CoreLogic’s April 2015 CoreLogic Home Price Index (HPI), home prices nationwide, including distressed sales, increased by 6.8 percent in April 2015 compared with April 2014. This change represents 38 months of consecutive year-over-year increases in home prices nationally. On a month-over-month basis, home prices nationwide, including distressed sales, increased by 2.7 percent in April 2015 compared with March 2015.Including distressed sales, 30 states plus the District of Columbia were at or within 10 percent of their peak prices in April. Eight states and the District of Columbia reached new price peaks not experienced since January 1976 when the CoreLogic HPI started. These states included Alaska, Colorado, Nebraska, New York, Oklahoma, Tennessee, Texas and Wyoming.Excluding distressed sales, home prices increased by 6.8 percent in April 2015 compared with April 2014 and increased by 2.3 percent month over month compared with March 2015. Excluding distressed sales, only South Dakota (-0.3 percent) and Louisiana (-0.2 percent) showed year-over-year depreciation in April. Distressed sales include short sales and real estate-owned (REO) transactions.The CoreLogic HPI Forecast indicates that home prices, including distressed sales, are projected to increase by 1.1 percent month over month from April 2015 to May 2015 and by 5.3 percent on a year-over-year basis from April 2015 to April 2016. Excluding distressed sales, home prices are projected to increase by 0.9 percent month over month from April 2015 to May 2015 and by 4.9 percent year over year from April 2015 to April 2016. The CoreLogic HPI Forecast is a projection of home prices using the CoreLogic HPI and other economic variables. Values are derived from state-level forecasts by weighting indices according to the number of owner-occupied households for each state.
“For the first four months of 2015, home sales were up 9 percent compared to the same period a year ago,” said Frank Nothaft, chief economist for CoreLogic. “One byproduct of the increased sales activity is rising house prices, and, as a result, month-over-month home prices are up almost 3 percent for April 2015 and up more than 6 percent from a year ago.””Old fashion supply and demand, fueled by historically low mortgage rates and improving consumer finances and confidence, continue to push home prices up,” said Anand Nallathambi, president and CEO of CoreLogic. “We expect continued price appreciation throughout 2015 and into next year. Over the longer term, household formation, up by more than one million over the past year alone, will drive down vacancy rates and create tighter housing markets in many metropolitan areas. This should provide the necessary underpinning for rising prices for the foreseeable future.”Highlights as of April 2015:
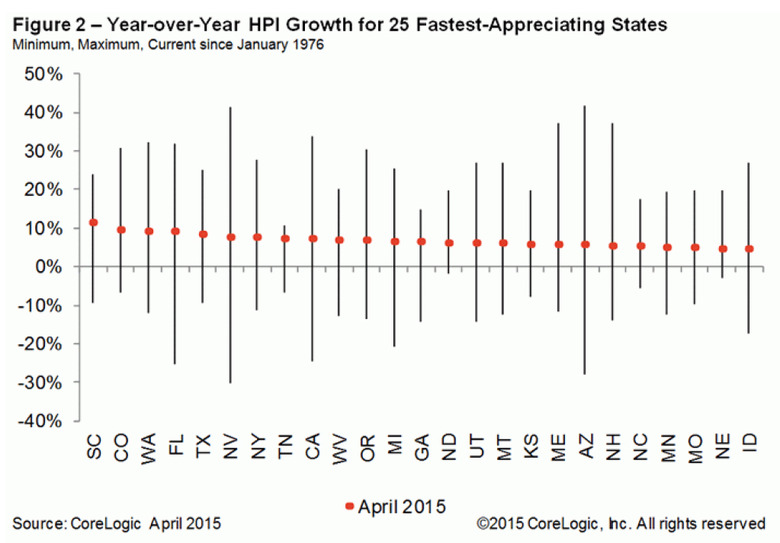
- Including distressed sales, the five states with the highest home price appreciation were: South Carolina (+11.4 percent), Colorado (+9.7 percent), Washington (+9.1 percent), Florida (+9 percent) and Texas (+8.3 percent).
- Excluding distressed sales, the five states with the highest home price appreciation were: South Carolina (+10 percent), Florida (+9.5 percent), Colorado (+9.3 percent), Washington (+8.7 percent) and Texas (+8.2 percent).
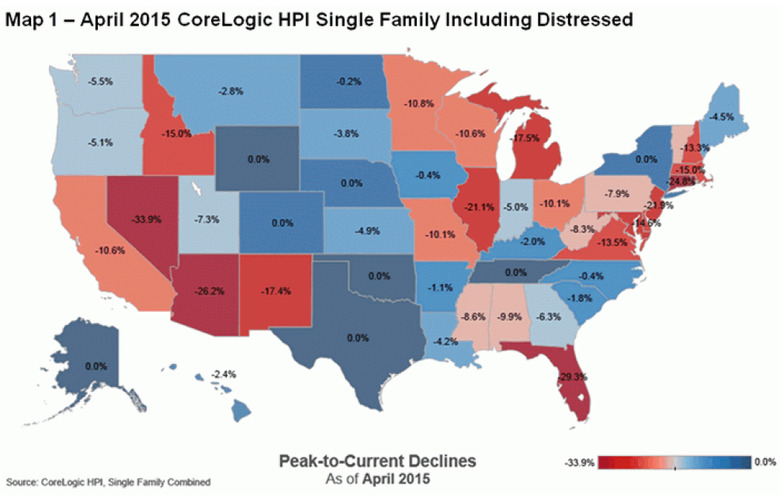
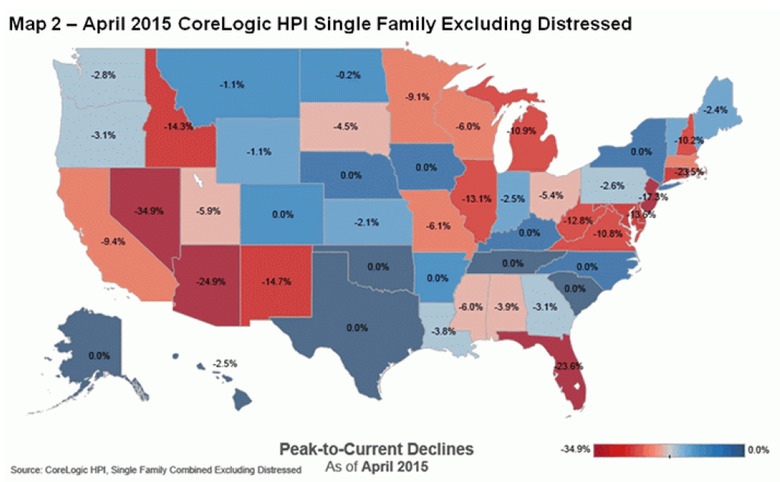
- Including distressed transactions, the peak-to-current change in the national HPI (from April 2006 to April 2015) was -9 percent. Excluding distressed transactions, the peak-to-current change for the same period was -5.1 percent.
- Including distressed sales, four states experienced year-over-year home price depreciation: Massachusetts (-1.7 percent), Louisiana (-1.5 percent), Connecticut (-1.1 percent) and Maryland (-0.7 percent).
- The five states with the largest peak-to-current declines, including distressed transactions, were: Nevada (-33.9 percent), Florida (-29.3 percent), Rhode Island (-28.2 percent), Arizona (-26.2 percent) and Connecticut (-24.8 percent).
- Of the top 100 Core Based Statistical Areas (CBSAs) measured by population, 92 showed year-over-year increases. The eight CBSAs that showed year-over-year declines were: Baltimore-Columbia-Towson, MD; Camden, NJ; Hartford-West Hartford-East Hartford, CT; New Orleans-Metairie, LA; Worcester, MA-CT; Albany-Schenectady-Troy, NY; New Haven-Milford, CT and Wilmington, DE-MD-NJ.