CALCULATED RISK
Early Reporting Markets suggest Sales in August close to July SAAR
By Bill McBride
This is the first look at several early reporting local markets in August. I’m tracking about 40 local housing markets in the US. Some of the 40 markets are states, and some are metropolitan areas. I’ll update these tables throughout the month as additional data is released.
Closed sales in August were mostly for contracts signed in June and July. Since 30-year fixed mortgage rates were in the 6.7% range in June, and 6.8% in July, compared to the mid-5% range the previous year, closed sales were down year-over-year in August.
For review on mortgage rates, here is a table of the Freddie Mac Primary Mortgage Market Survey® data (includes points, so lower than the rate with no points).

As of last night, 30-year rates were over 7%. This mortgage rate is from MortgageNewsDaily.com and is for top tier scenarios with zero points.

The higher rates in July, August and early September, will likely impact closed sales in September and October.
Local Comments
Las Vegas REALTORS® (LVR): LVR reports stable home prices, record high condo prices; LVR housing statistics for August 2023
LVR reported that the median price of existing single-family homes sold in Southern Nevada through its Multiple Listing Service (MLS) during August was $447,435. That’s down 0.6% from $450,000 in August of 2022. Local home prices are still below the all-time record of $482,000 set in May of 2022.
The median price of local condos and townhomes sold in August set a new all-time high of $287,000. That’s up 8.3% from $264,900 in August of 2022 and tops the previous record of $285,000 set in May 2022.
Active Inventory in August
Here is a summary of active listings for these early reporting housing markets in August.
Inventory surged in some of these markets last year, but that has changed.
For example, inventory in Denver was up 94% YoY in August 2022, and is now down 1% YoY. And inventory in Las Vegas was up 149% YoY in August 2022, and is now down 51% YoY. That is a HUGE change.
Inventory for these markets were down 20% YoY in July and are now down 15% YoY.
Notes for all tables:
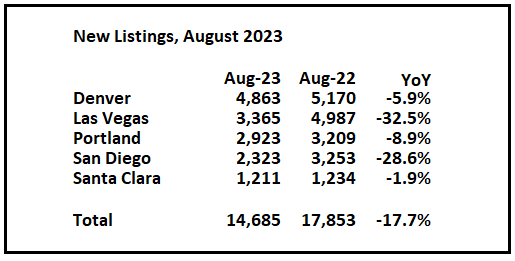
New Listings in August
And here is a table for new listings in August (some areas don’t report new listings). For these areas, new listings were down 17.7% YoY. Potential sellers that are locked into their current homes with low mortgage rates has pushed down new listings.
Last month, new listings in these markets were down 32.6% YoY. The decline in new listing in August – for these areas – was smaller than the YoY decline for the last several months.
Closed Sales in August
And a table of August sales.
In August, sales in these markets were down 10.3%. In July, these same markets were down 11.8% YoY Not Seasonally Adjusted (NSA).

This is a slightly smaller YoY decline NSA than in July for these early reporting markets. Note that there were the same number of selling days each year in August 2022 and August 2023.
A key factor in the smaller YoY decline was that sales were steadily declining last year due to higher mortgage rates. This graph shows existing home sales by month for 2022 and 2023, on a Seasonally Adjusted Annual Rate (SAAR) basis.
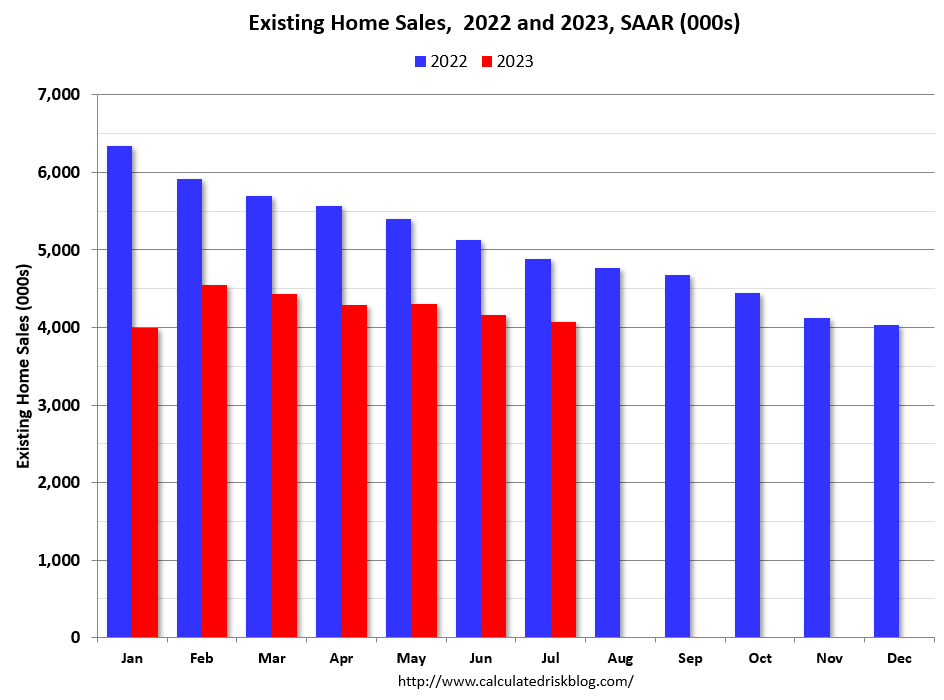
This early data suggests the August existing home sales report will show another significant YoY decline – and probably close to the July sales rate of 4.07 million (SAAR) – and the 24th consecutive month with a YoY decline in sales.
This was just several early reporting markets. Many more local markets to come!