Inman News
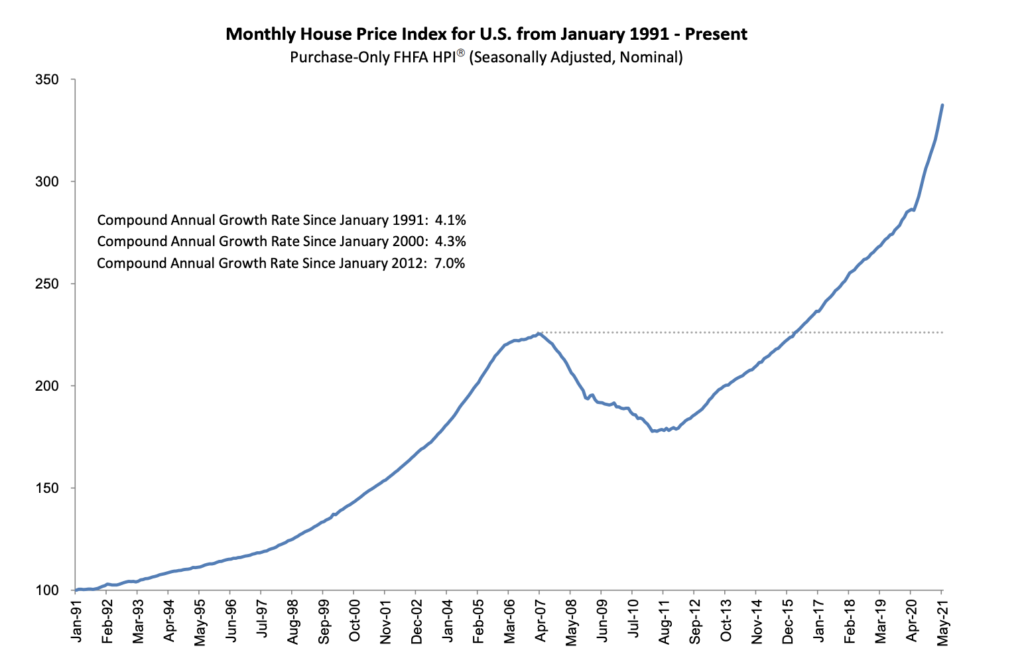
Annual home price growth reached an all-time high of 18% in May, according to the Federal Housing Finance Agency’s latest home price index report.
Home price growth is continuing its record-breaking trajectory, according to the Federal Housing Finance Agency’s latest Home Price Index report released on Tuesday. Prices increased 1.7 percent month over month and 18 percent year over year in May — 2.3 percent above April’s annual index.

On a monthly basis, the Pacific division led the way in gains (+2.4 percent), followed by the New England division (+2.3 percent), and the Mountain division (+2.2 percent). On an annual basis, the Mountain division experienced the largest jump in prices (+23.2 percent), followed by the New England division (+21.8 percent) and the Pacific division (+21.4 percent).
“House prices continued their record-setting growth into May,” FHFA Deputy Director of the Division of Research and Statistics Dr. Lynn Fisher said in a statement. “This trend will likely continue around the country as busy summer homebuying months maintain the pressure being felt in already tight housing markets.”
Advisor Perspectives analyst Jill Mislinski said the latest FHFA HPI report confirms the market is experiencing a housing bubble, albeit very different from the last one in 2007 and 2008.
“The nominal HPI index has exceeded its pre-recession peak of what’s generally regarded to have been a housing bubble. Adjusted for inflation, the index is now at 179, also at its all-time high,” she explained.
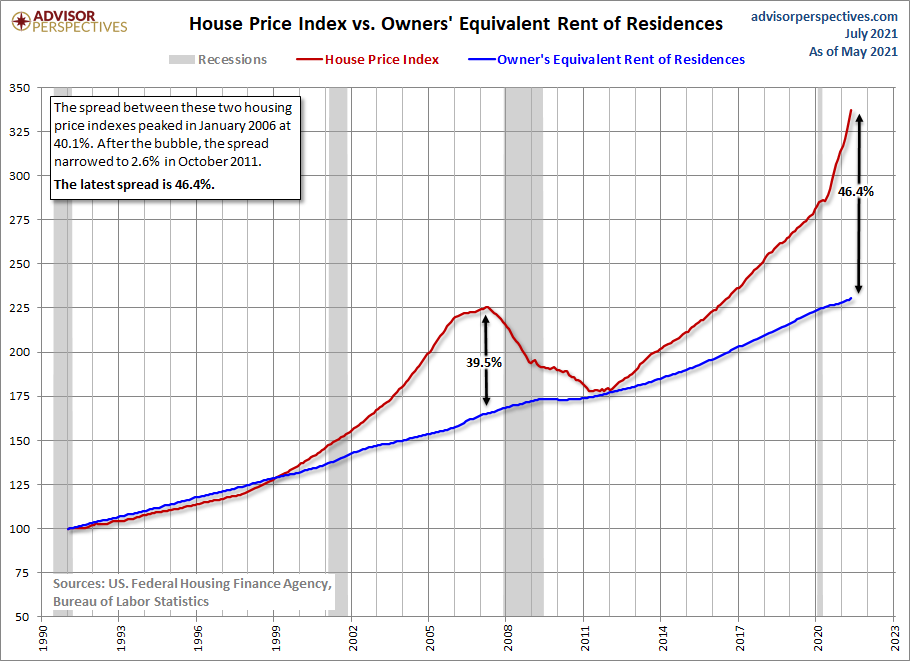
Mislinski compared the HPI and a subcomponent of the Bureau of Labor Statistics’ Consumer Price Index, the Owners’ Equivalent Rent of Residences (OER).
Credit: Advisor Perspectives
“HPI and the OER moved in close parallel from the 1991 inception date of the former until early 1999 when the two parted company and HPI began accelerating into the housing bubble,” she said. “HPI then fell 20.7 percent over the next 48 months to its March 2007 trough.”
“Confirmation of the “bubble” designation for house prices is the 39.5 percent spread between HPI and OER in January 2006,” she added. “Are we in another housing bubble? The current spread is 46.4 percent, exceeding the bubble designation just mentioned.”
The FHFA HPI measures changes in single-family home values based on home sales data across over 400 U.S. cities in all 50 states, explained a previous Inman article. The HPI is based on “a weighted, repeat-sales statistical technique to analyze house price transaction data.”

