CALCULATED RISK
By Bill McBride
In November 2021, I wrote Inventory will Tell the Tale and recounted how changes in housing inventory had helped me forecast the housing market at several key points.
I believe inventory will tell the tale. That is why I watch inventory closely.
So, based on the low level of inventory in March 2022, I wrote Housing: Don’t Compare the Current Housing Boom to the Bubble and Bust, and I expected a decline in real house prices (inflation adjusted), and little decline in nominal prices.
I noted we could be fairly confident that we wouldn’t see cascading nominal price declines like during the housing bust since there would be few distressed sales.
Then, as inventory picked up sharply in 2022, I adjusted my outlook in October 2022 and wrote House Prices: 7 Years in Purgatory. I noted that a 10% decline in nominal prices “now seemed likely”.
Here is a graph of active listing from Realtor.com through June. Note the surge in inventory in mid-2022 as mortgage rates increased.
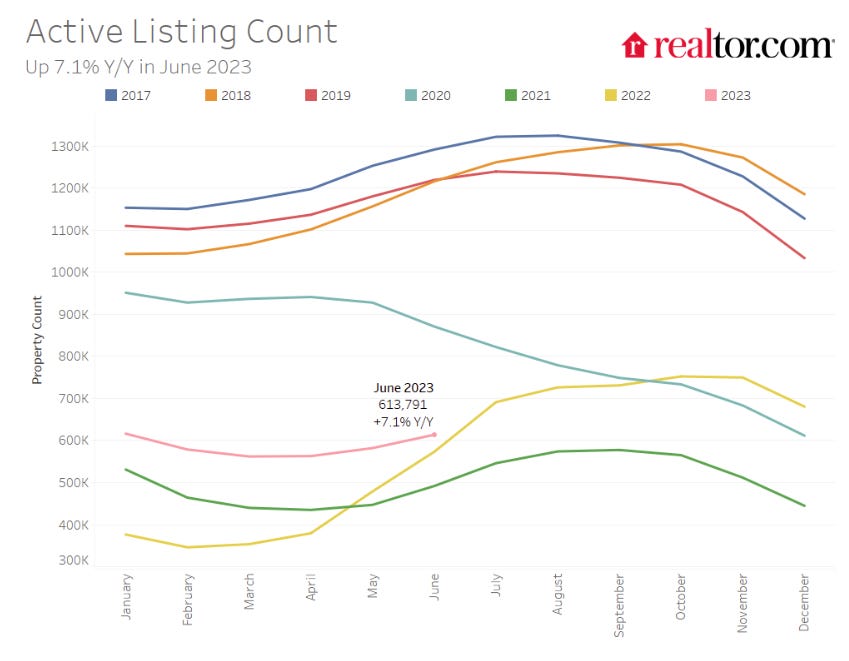
However, the inventory surge in 2022 was somewhat of a head fake! Some potential sellers quickly listed their homes, probably remembering what happened with house prices in the 2006 to 2011 period, but that surge ended pretty quickly.
Here is a similar graph from Altos Research through this week.

The red line is for 2023. The black line is for 2019. Inventory picked up sharply in 2022 as mortgage rates increased. This year there was little seasonal increase in inventory, and inventory is now down year-over-year.
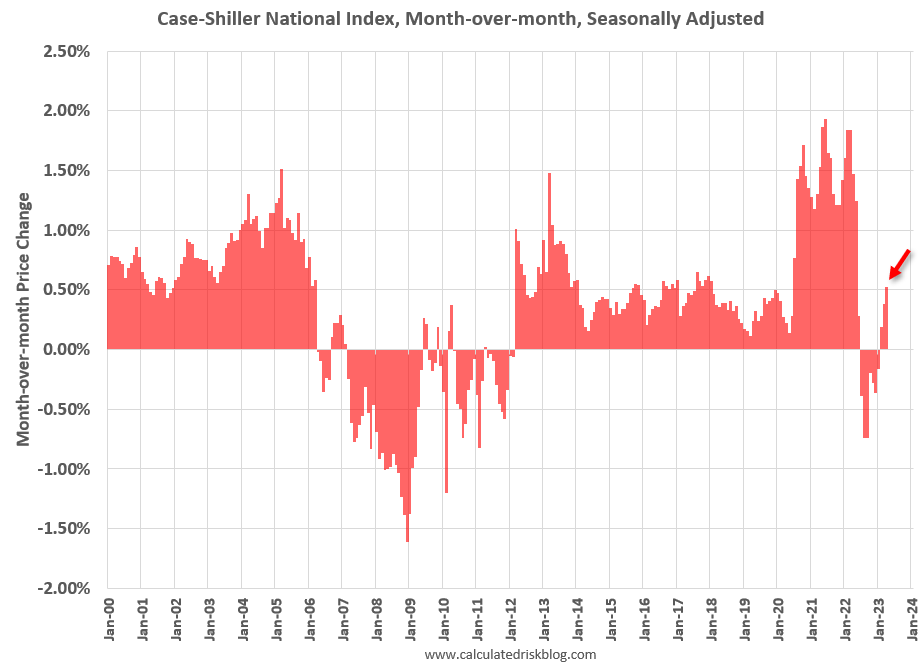
So far, the seasonally adjusted Case-Shiller National Index has seen a maximum nominal decline of 2.9% from the peak, and a 4.6% decline in real prices adjusted using CPI ex-shelter.
And house prices have increased a little recently. The MoM increase in the seasonally adjusted Case-Shiller National Index was at 0.53% in April. This was the third consecutive MoM increase following seven straight MoM decreases, and other indexes suggest further increases in May and June.
As I noted in House Price Battle Royale: Low Inventory vs Affordability
Inventory is pushing up prices, and affordability (the change in monthly payments) is pushing down prices. And it appears this battle will continue … there is no relief in sight for inventory or for mortgage rates.
The question now is:
Will house prices decline further later this year?
First, we can be very confident – barring another crisis – that we will not see a large wave of distressed sales and cascading declines in nominal house prices. Lending has been reasonably solid over the last decade, and most homeowners have substantial equity in their homes.
Second, it is likely that real prices (inflation adjusted) will stay below the previous peak for some time. The real return following the ‘79 peak was 6.5 years. It took 11 years for real prices to reach the previous peak following the peak in ‘89.
And it took 14.5 years to return to the real peak reached during the housing bubble.
Typically following a downturn, it takes a long time for prices to return to the previous real price peak. Of course, homeowners think in nominal terms, and if prices just “stall”, they usually don’t notice the inflation adjusted price decline.

But the key will be inventory.
Why do people sell their homes?
Historically the Three D’s of housing that forced homeowners to sell, or go into foreclosure, were Death, Divorce, or Disease. Fortunately, there is less selling now due to disease with more widespread health coverage, and many market participants have changed the third D to debt.
People also move for employment opportunities, for retirement, to upsize for more space or a better location, or to downsize.
The decline in inventory following the onset of the pandemic is probably mostly from the lack of potential move-up buyers who feel locked in by their current low mortgage rate.
What can unlock these potential move-up buyers and push inventory back to pre-pandemic levels? Lower mortgage rates would help, but it is unlikely we will see 30-year mortgage rates below 4% without another crisis.
Here is a repeat of some data I posted last week from the recently released FHFA’s National Mortgage Database showing the distribution of interest rates on closed-end, fixed-rate 1-4 family mortgages outstanding at the end of each quarter since Q1 2013 through Q1 2023.

This shows the surge in the percent of loans under 3%, and also under 4%, starting in early 2020 as mortgage rates declined sharply during the pandemic. Currently 23.3% of loans are under 3%, 61.3% are under 4%, and 81.2% are under 5%.
All those homeowners with mortgages under 4% – or even under 5% – are feeling locked in right now (but happy with their mortgage rate)!
The passage of time will help. As homeowners become accustomed to higher mortgage rates, their need to move-up might outweigh the additional mortgage expense.
When the baby-boom generation starts moving to retirement homes or warmer climates, inventory will likely increase. But that is mostly a 2030s story, see: Housing Inventory and Demographics: The Next Big Shift
Inventory will tell the tale, and it is difficult to see nominal prices declining much with near record low levels of inventory. We will see the normal seasonal weakness in prices later this year, but probably only small declines in seasonally adjusted house prices.
If the story starts to change, I’ll post an update.