CALCULATEDRISK
By Bill McBride
Housing Starts Decreased to 1.460 million Annual Rate in December
From the Census Bureau: Permits, Starts and Completions
Housing Starts:
Privately‐owned housing starts in December were at a seasonally adjusted annual rate of 1,460,000. This is 4.3 percent below the revised November estimate of 1,525,000, but is 7.6 percent above the December 2022 rate of 1,357,000. Single‐family housing starts in December were at a rate of 1,027,000; this is 8.6 percent below the revised November figure of 1,124,000. The December rate for units in buildings with five units or more was 417,000.
An estimated 1,413,100 housing units were started in 2023. This is 9.0 percent below the 2022 figure of 1,552,600.
Building Permits:
Privately‐owned housing units authorized by building permits in December were at a seasonally adjusted annual rate of 1,495,000. This is 1.9 percent above the revised November rate of 1,467,000 and is 6.1 percent above the December 2022 rate of 1,409,000. Single‐family authorizations in December were at a rate of 994,000; this is 1.7 percent above the revised November figure of 977,000. Authorizations of units in buildings with five units or more were at a rate of 449,000 in December.
An estimated 1,469,800 housing units were authorized by building permits in 2023. This is 11.7 percent below the 2022 figure of 1,665,100.
emphasis added
The first graph shows single and multi-family housing starts since 2000 (including housing bubble).
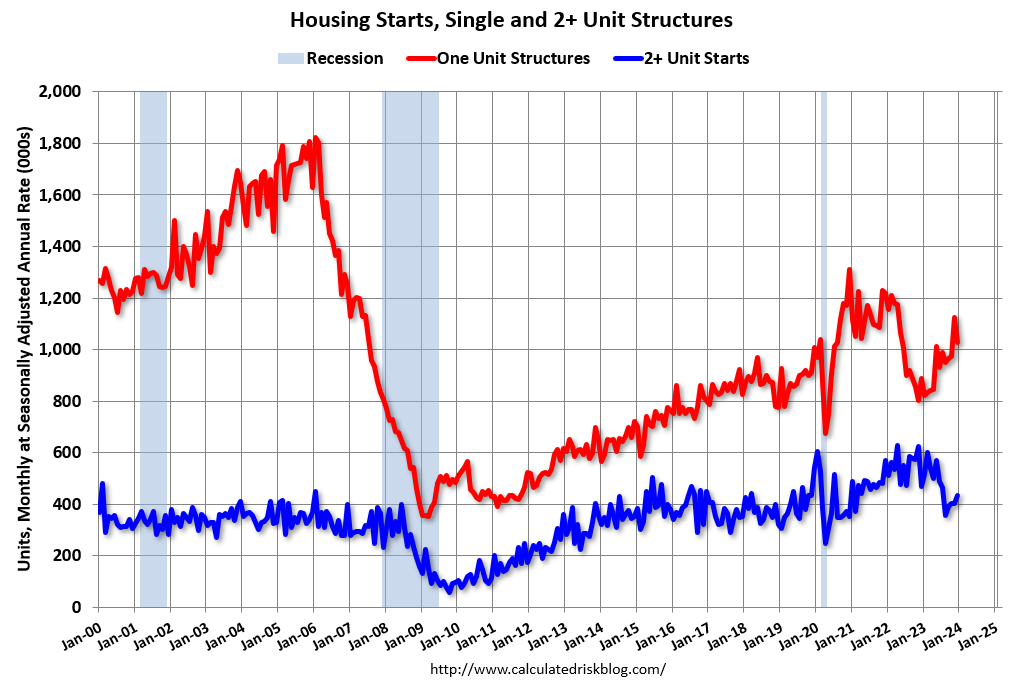
Multi-family starts (blue, 2+ units) increased in December compared to November. Multi-family starts were down 7.9% year-over-year in December. Single-family starts (red) decreased in December and were up 15.8% year-over-year.
Note that the weakness in 2022 and early 2023 had been in single family starts (red), however the weakness has moved to multi-family now while single family has bounced back from the bottom.
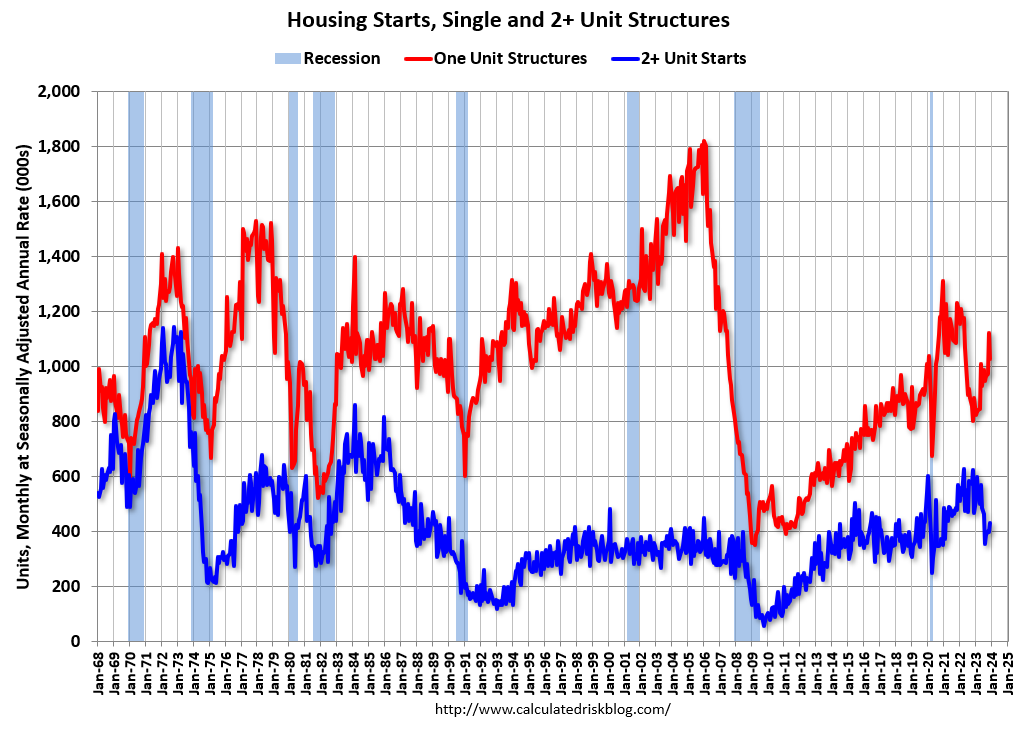
The second graph shows single and multi-family starts since 1968. This shows the huge collapse following the housing bubble, and then the eventual recovery – and the recent collapse and now recovery in single-family starts.
Total housing starts in December were above expectations, however, starts in October and November were revised down, combined.
The third graph shows the month-to-month comparison for total starts between 2022 (blue) and 2023 (red).
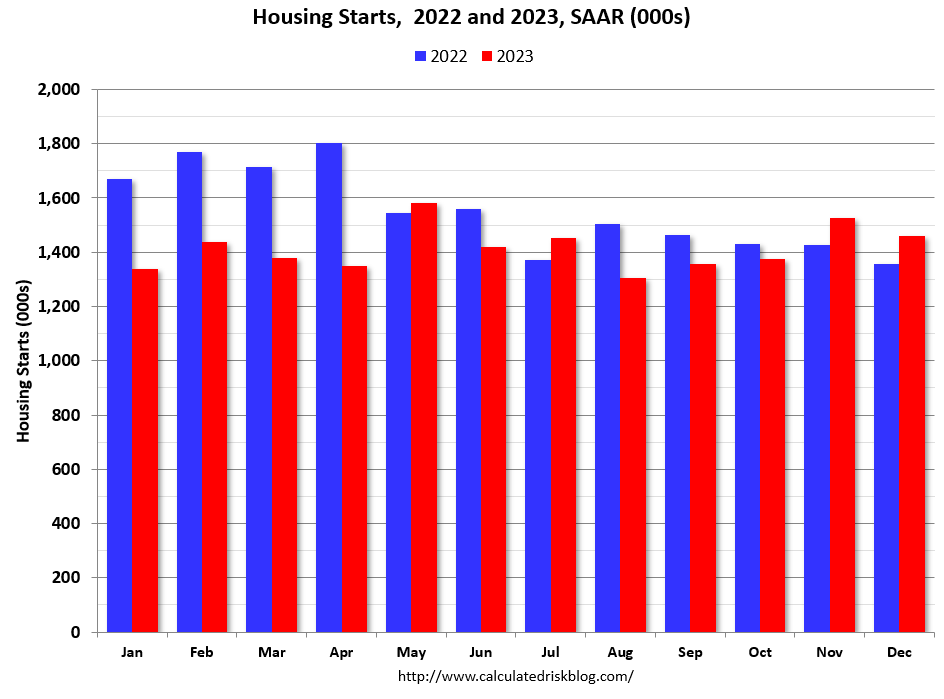
Total starts were up 7.6% in December compared to December 2022. And starts in 2023 were down 9.0% compared to 2022.
Starts were down year-over-year for 16 of the last 20 months, although starts were up year-over-year in 4 of the last 8 months. The year-over-year comparisons will be easier in 2024.
Near Record Number of Multi-Family Housing Units Under Construction
The fourth graph shows housing starts under construction, Seasonally Adjusted (SA).
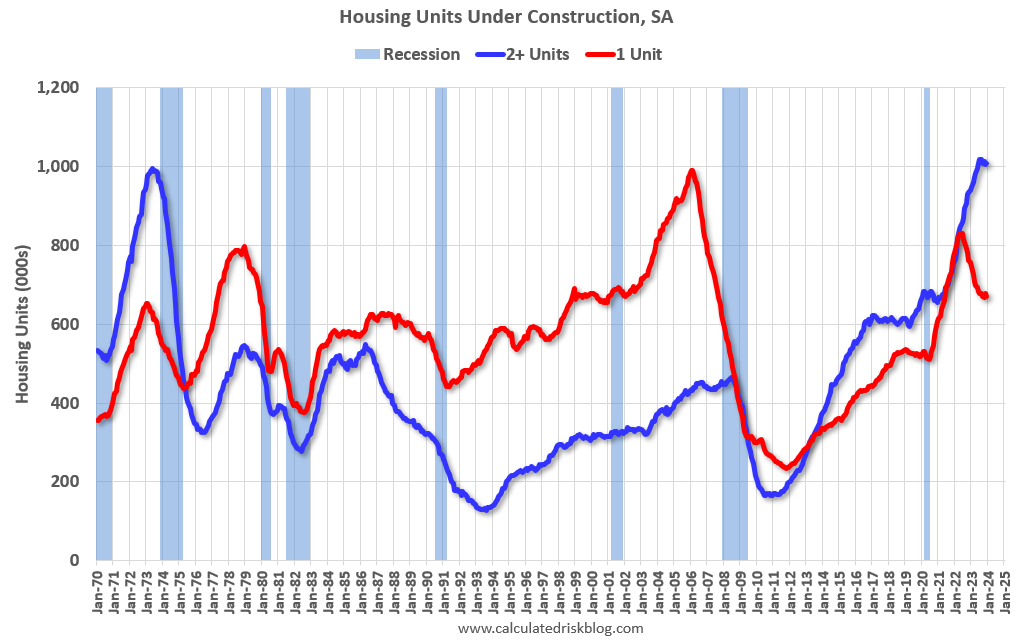
Red is single family units. Currently there are 671 thousand single family units (red) under construction (SA). This was down in December compared to November, and 160 thousand below the recent peak in May 2022. Single family units under construction peaked over a year ago since single family starts declined sharply and supply chain constraints have eased.
Blue is for 2+ units. Currently there are 1,008 thousand multi-family units under construction. This is slightly below the record set in July 2023 of 1,018 thousand. For multi-family, construction delays have been a significant factor, but it appears multi-family units under construction has peaked and will likely decline significantly in 2024.
Combined, there are 1.679 million units under construction, just 31 thousand below the all-time record of 1.710 million set a year ago in October 2022.
Comparing Starts and Completions
Below is a graph comparing multi-family starts and completions. Since it usually takes over a year on average to complete a multi-family project, there is a lag between multi-family starts and completions. Completions are important because that is new supply added to the market and starts are important because that is future new supply (units under construction is also important for employment).
These graphs use a 12-month rolling total for NSA starts and completions.
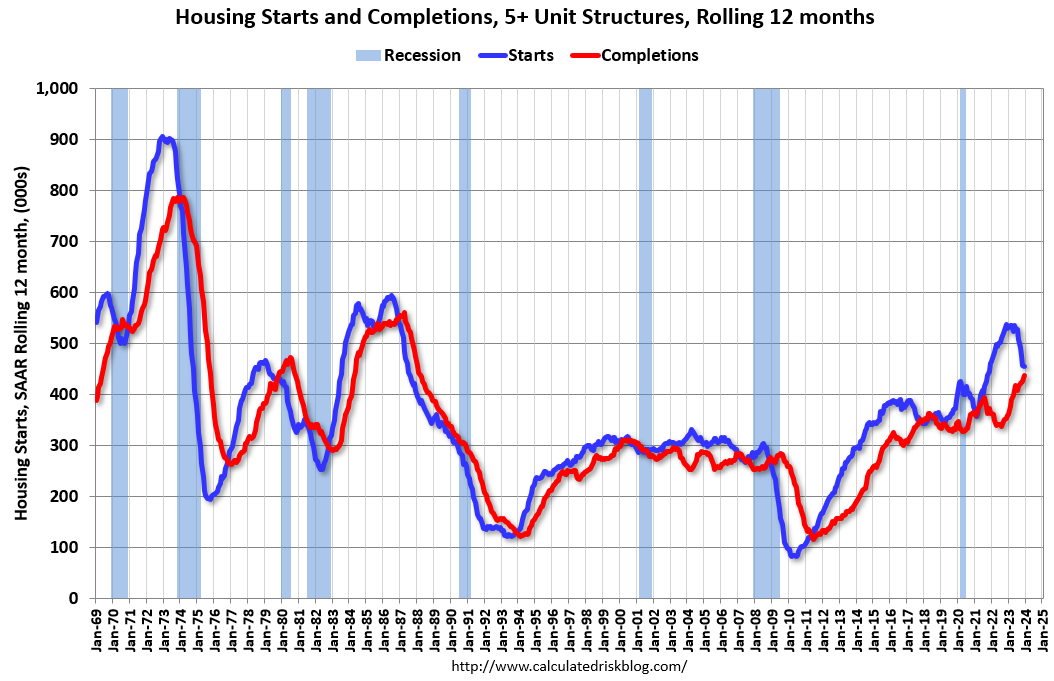
The blue line is for multifamily starts and the red line is for multifamily completions. Multifamily starts will likely decline further on a rolling 12-month basis, and completions will increase over the next year.
The last graph shows single family starts and completions. It usually only takes about 6 months between starting a single-family home and completion – so the lines are much closer than for multi-family. The blue line is for single family starts and the red line is for single family completions.
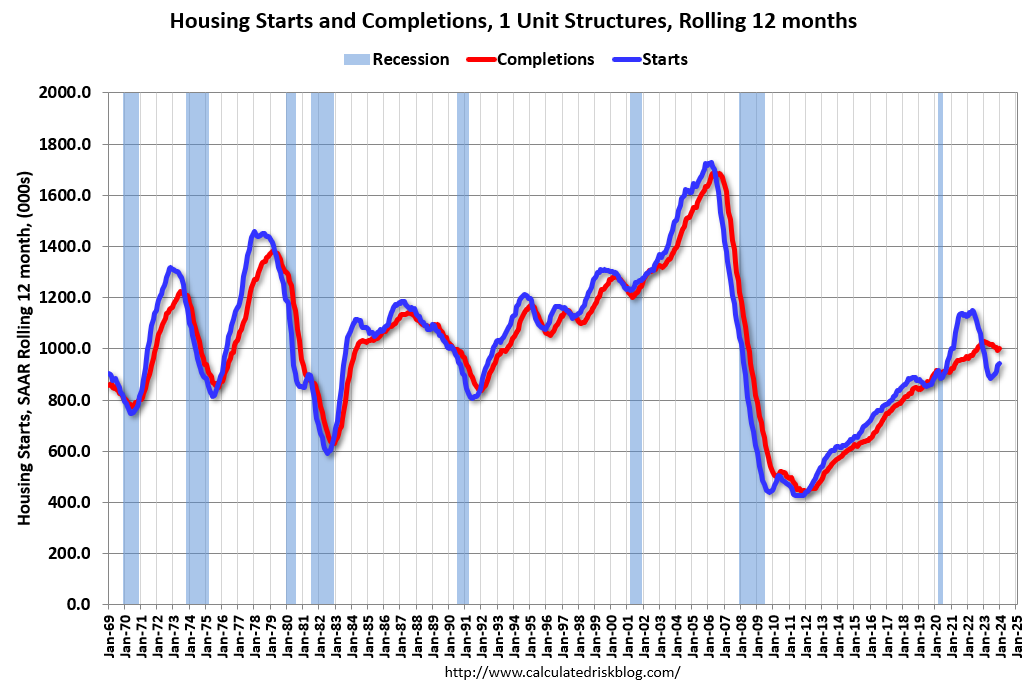
Builders are now completing more single-family homes than they are starting on a 12-month basis. However, single family starts have turned up on a 12-month basis.
Conclusions
Total housing starts in December were above expectations, however, starts in October and November were revised down, combined. The weakness in 2022 and early 2023 was in single family starts. However, single family starts have now picked up, helped by limited existing home inventory. The bottom for single family starts was a year ago in November 2022 and single-family starts were up 16% year-over-year in December.
The expected weakness in multi-family starts began last summer, and we should see ongoing weakness in the sector based on less household formation, falling asking rents, rising vacancies, and tighter lending. We saw this coming in the National Multifamily Housing Council’s (NMHC’s) Quarterly Survey of Apartment Market Conditions and in the Architectural Billings Index that showed a decline in multi-family design for the 16th consecutive month in November.
A near record number of multi-family housing units are currently under construction due to construction delays. This suggests a large number of multi-family housing units will be delivered in 2024.