CALCULATEDRISK
By Bill McBride
Lowest Annual Sales Since 1995
From the NAR: Existing-Home Sales Slid 1.0% in December
Existing-home sales retreated in December, according to the National Association of REALTORS®. Among the four major U.S. regions, sales slipped in the Midwest and South, rose in the West and were unchanged in the Northeast. All four regions experienced year-over-year sales decreases.
On an annual basis, existing-home sales (4.09 million) dropped to the lowest level since 1995, while the median price reached a record high of $389,800 in 2023.
Total existing-home sales – completed transactions that include single-family homes, townhomes, condominiums and co-ops – decreased 1.0% from November to a seasonally adjusted annual rate of 3.78 million in December. Year-over-year, sales declined 6.2% (down from 4.03 million in December 2022).
…
Total housing inventory registered at the end of December was 1 million units, down 11.5% from November but up 4.2% from one year ago (960,000). Unsold inventory sits at a 3.2-month supply at the current sales pace, down from 3.5 months in November but up from 2.9 months in December 2022.
emphasis added
The sales rate was below the consensus forecast.
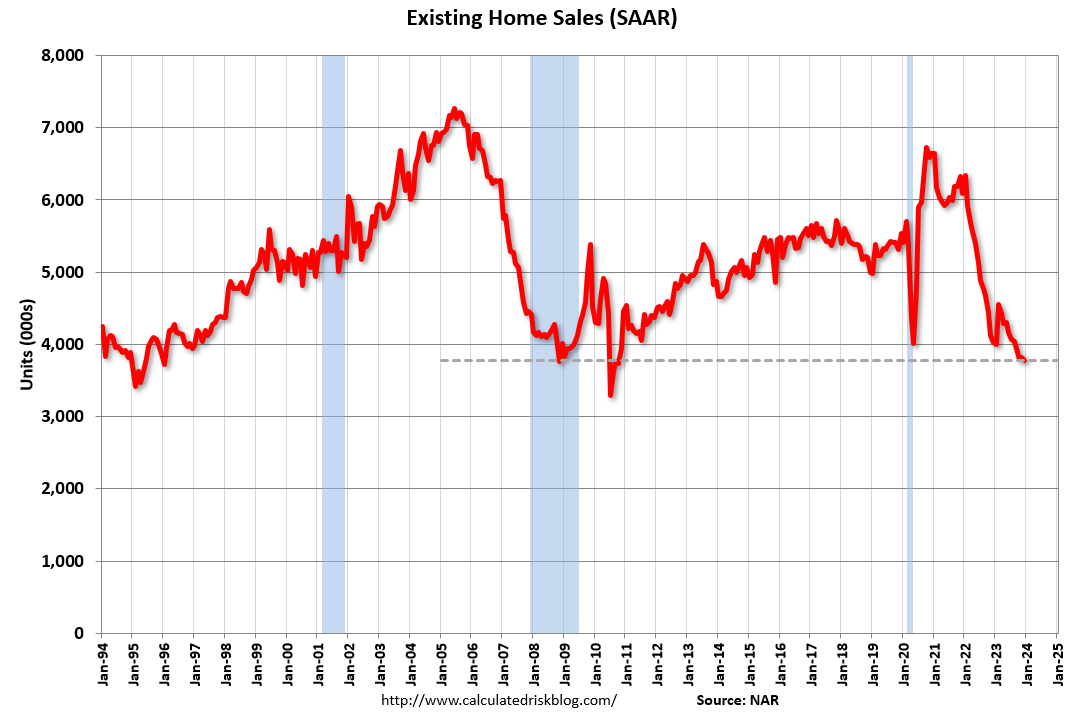
Sales in December (3.78 million SAAR) were down 1.0% from the previous month and were 6.2% below the December 2022 sales rate. This is a new cycle low.
Housing Inventory Decreased Seasonally in December
The second graph shows nationwide inventory for existing homes.
According to the NAR, inventory decreased to 1.00 million in December from 1.13 million the previous month.
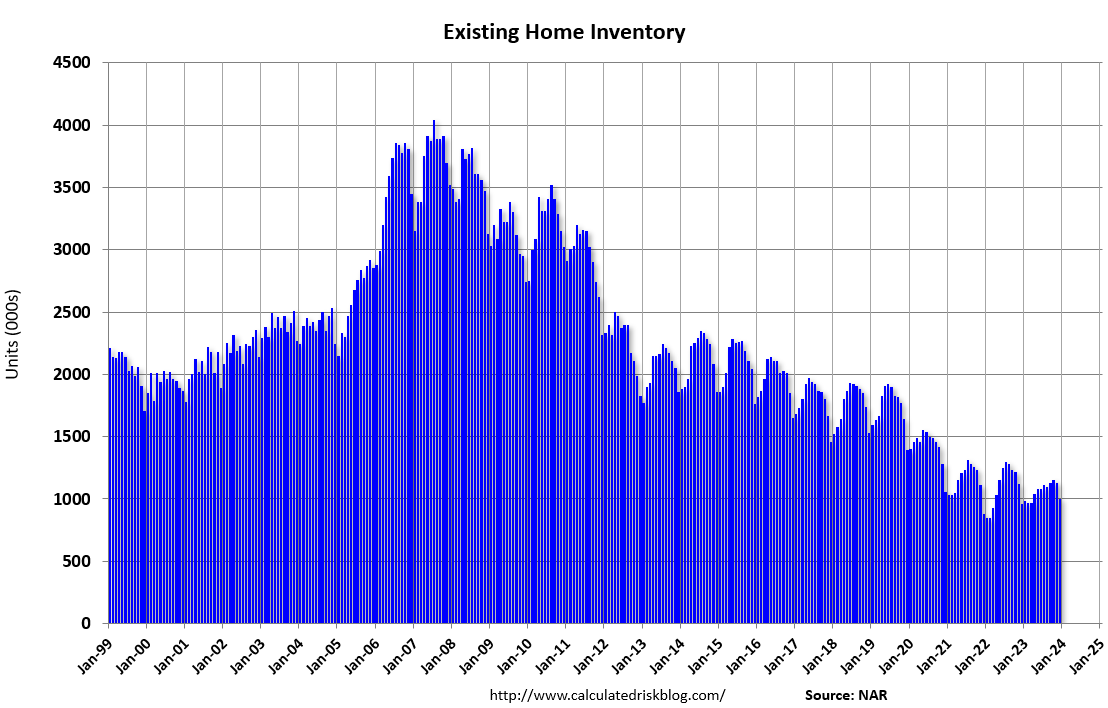
Headline inventory is not seasonally adjusted, and inventory usually decreases to the seasonal lows in December and January, and peaks in mid-to-late summer. The third graph shows the year-over-year (YoY) change in reported existing home inventory and months-of-supply. Since inventory is not seasonally adjusted, it really helps to look at the YoY change. Note: Months-of-supply is based on the seasonally adjusted sales and not seasonally adjusted inventory.
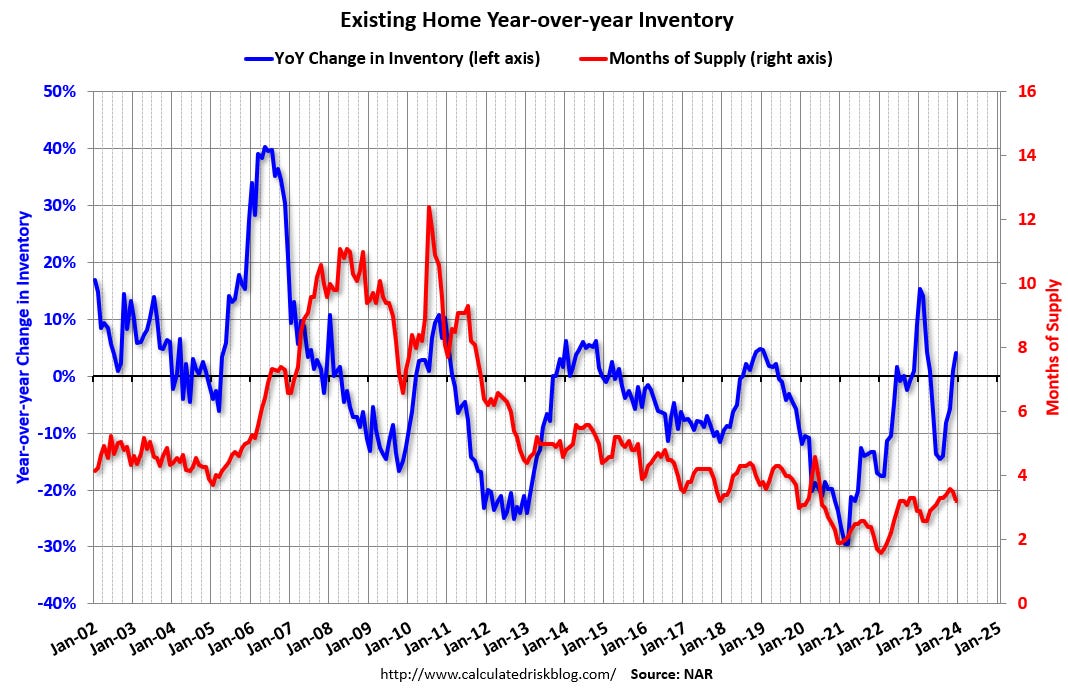
Inventory was up 4.2% year-over-year (blue) in December compared to December 2022. Months-of-supply (red) decreased to 3.2 months in December from 3.5 months the previous month.
In December 2019, months-of-supply was at 3.0 months, so there is actually more supply now, on a months-of-supply basis, than prior to the pandemic. This is due to a sharp decline in both sales and inventory.
Sales Year-over-Year and Not Seasonally Adjusted (NSA)
The fourth graph shows existing home sales by month for 2022 and 2023.
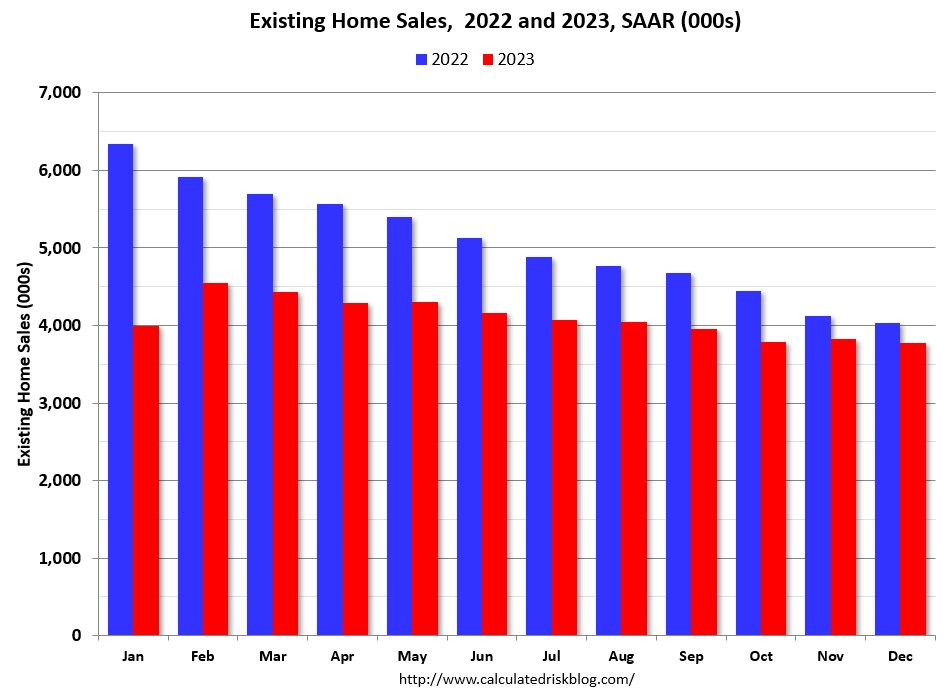
Sales declined 6.2% year-over-year compared to December 2022. This was the twenty-eighth consecutive month with sales down year-over-year. This was just below the previous cycle low of 3.79 million SAAR in October.
On an annual basis, sales were down 19% from 2022 to the lowest level since 1995.
The fifth graph shows existing home sales for each month, Not Seasonally Adjusted (NSA), for a few selected periods. Black and light Purple are the maximum sales per month during the bubble (2005) and the minimum sales during the bust (2008 – 2011). The most recent five years are shown (2019 through 2023).
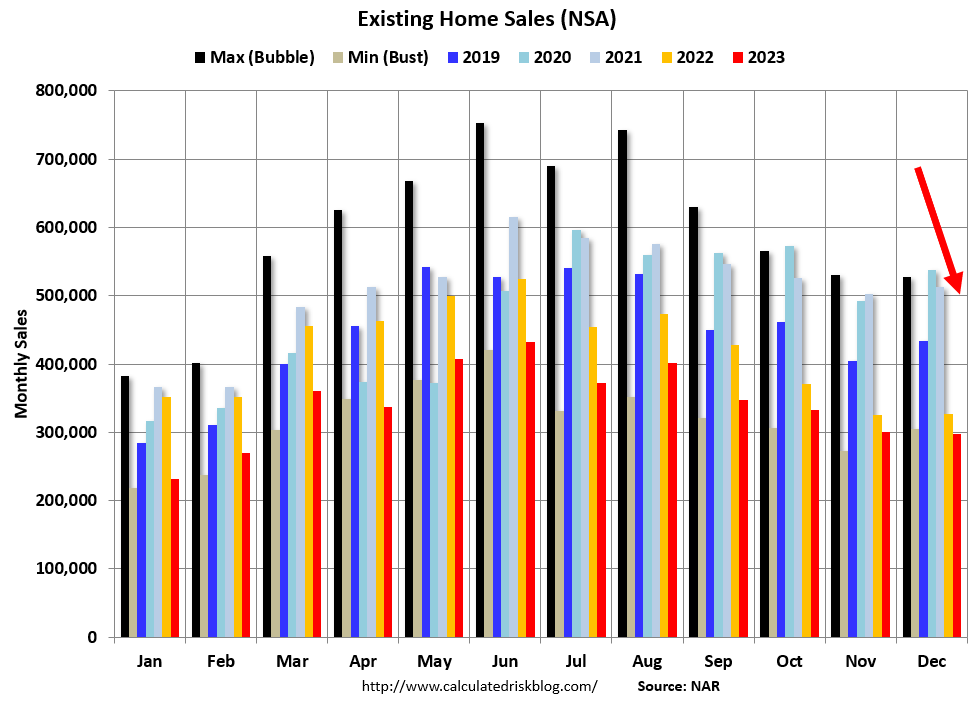
Sales NSA in December (297,000) were 9.2% below sales in December 2022 (327,000). Note there was one fewer of selling day in December this year compared to last year, so the decline in sales NSA was larger than the seasonally adjusted decline.
On an NSA basis for the month of December this was 2.6% below the previous record low for December during the housing bust (305,000 in December 2008).
Median House Prices Increased 4.4% Year-over-Year
On prices, the NAR reported:
The median existing-home price for all housing types in December was $382,600, an increase of 4.4% from December 2022 ($366,500). All four U.S. regions posted price increases.
Median prices are distorted by the mix (repeat sales indexes like Case-Shiller and FHFA are probably better for measuring prices).
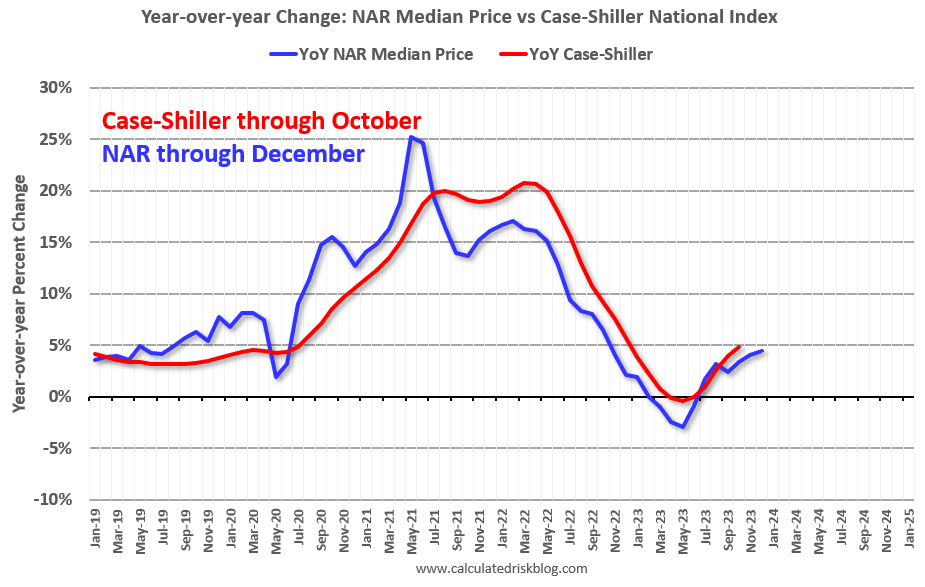
The YoY change in the median price peaked at 25.2% in May 2021 and bottomed at -3.0% in May 2023. Prices are now up 4.4% YoY. Median house prices decreased 1.3% from November to December (the 6th consecutive month-to-month decline as prices are in the seasonally weak period) and prices are down 7.5% from the peak in June 2022 (NSA).
Typically, the NAR median price starts to increase in February (seasonally). This will be something to watch.
The median price tends to lead the Case-Shiller index, and this suggests a slight YoY increase in the Case-Shiller index over the next couple of months.
Note that closed sales in December were mostly for contracts signed in October and November. Mortgage rates, according to the Freddie Mac PMMS, averaged around 7.6% in October and 7.4% in November.
January sales will be mostly for contracts signed in November and December, and mortgage rates averaged 6.9% in December, so seasonally adjusted closed sales will likely increase in the January report.
Watch Inventory!
As I mentioned in Inventory will Tell the Tale, it was possible that months-of-supply will be back to 2019 levels soon. This happened in December – at least for one month! In December 2019, months-of-supply was 3.0 months, and in December 2023 months-of-supply was at 3.2 months.
Months-of-supply will likely be below 2019 levels for the next several months, but this will be something to watch. Note that months-of-supply peaked at 4.3 months in 2019.
I’ll be watching inventory closely over the next several months.