Completions Will Likely Increase Further in 2024
CALCULATEDRISK
By Bill McBride
Although total housing starts decreased 9.0% in 2023 compared to 2022, completions increased year-over-year. Construction delays impacted completions in 2023, and that left a near record number of housing units under construction. However, there still were 1.543 million total completions and placements in 2023, the most since 2007.
Not counting Manufactured homes, there are 1.453 million completions in 2023, up 4.5% from 1.390 million in 2022, and also the most since 2007.
This graph shows total housing completions and placements since 1968 through2023. Note that the net addition to the housing stock is less because of demolitions and destruction of older housing units. The housing start report last week indicated 1,002.4 thousand single family completions in 2023, 11.5 thousand in 2-to-4 units, and 438.6 thousand in 5+ units (up 22% from 2022, and the most since 1987).
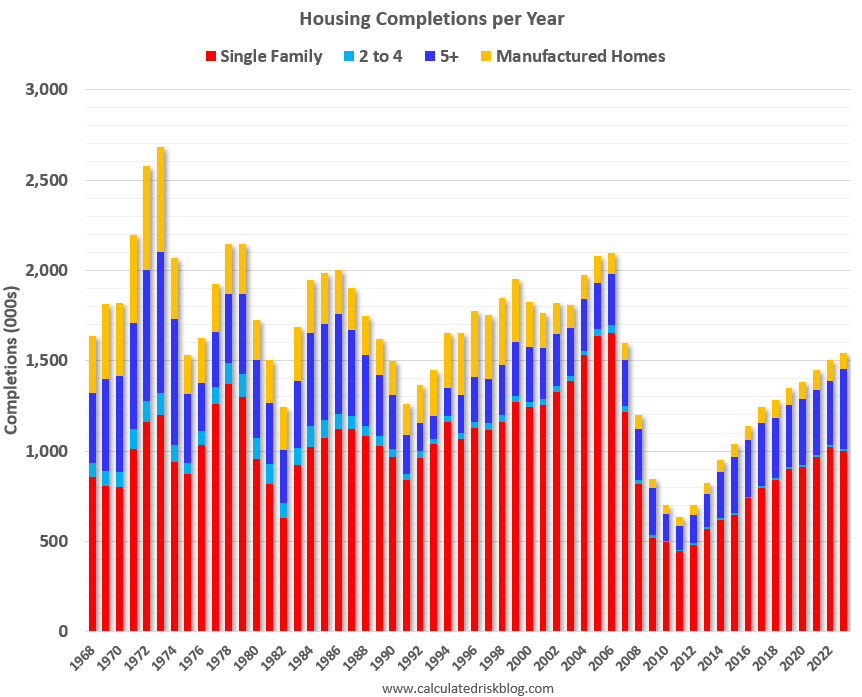
Estimate note on manufactured homes: In February, the Census Bureau will release the shipments of manufactured homes for December and for all of 2023. There were 82.8 thousand shipments through November, and my estimate is there were 90 thousand total placements in 2023, down from 112.9 thousand in 2022, and the fewest since 2016.
Completions Will Likely Increase Further in 2024
First, total starts will likely decline in 2024 driven by another significant year-over-year decrease in multi-family starts. There were 945 thousand single-family starts in 2023, but single-family starts picked up a little at the end of 2023, and single-family will likely increase a little in 2024.
For multi-family (5+ units), there were 469 thousand starts in 2023, down sharply from 547 thousand in 2022. Multi-family starts decreased to 408 thousand SAAR over the last half of 2023, and leading indicators suggest we will see continued weakness in multi-family starts in 2024.
However, completions will likely increase further in 2024. Below is a graph comparing multi-family starts and completions. Since it usually takes about 17 months on average to complete a multi-family project, there is a lag between multi-family starts and completions. This graph uses a 12-month rolling total for NSA starts and completions.
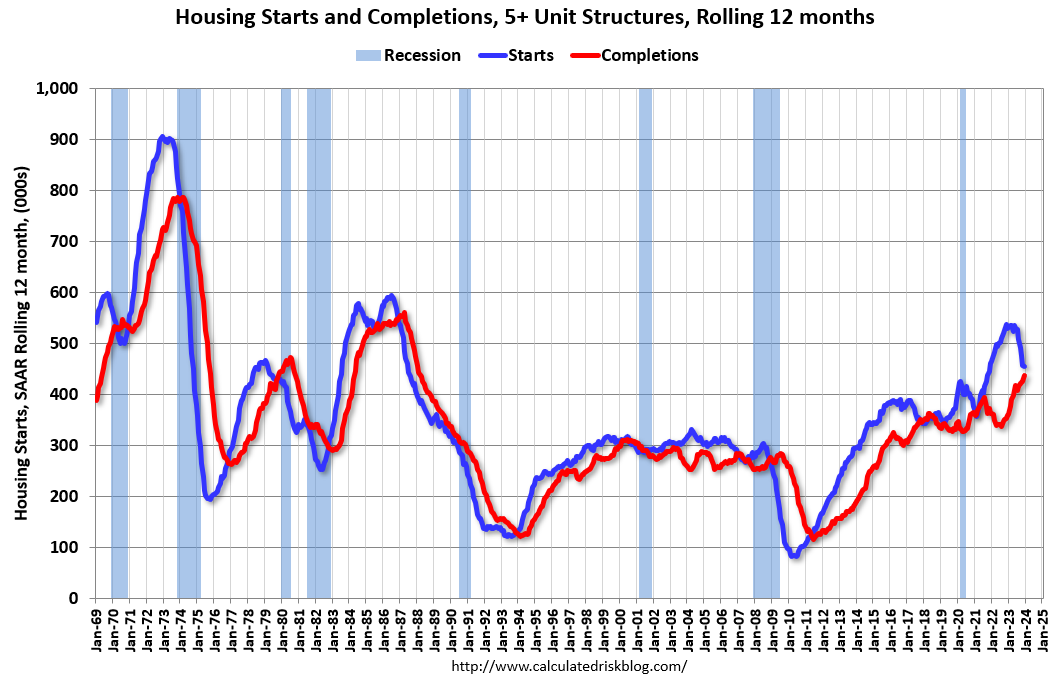
The blue line is for multifamily starts and the red line is for multifamily completions. We can build a model with a 17-month lag and guess how many multi-family units will be completed in 2024. This suggests between 475 and 500 thousand completed 5+ units in 2024, up from 439 thousand in 2023. It could be more or less depending on lingering supply constraints.
We can build a similar model for single-family units. In this case, completions only lag starts by about 8 months. That suggests single-family completions of around 975 thousand to 1.0 million this year.
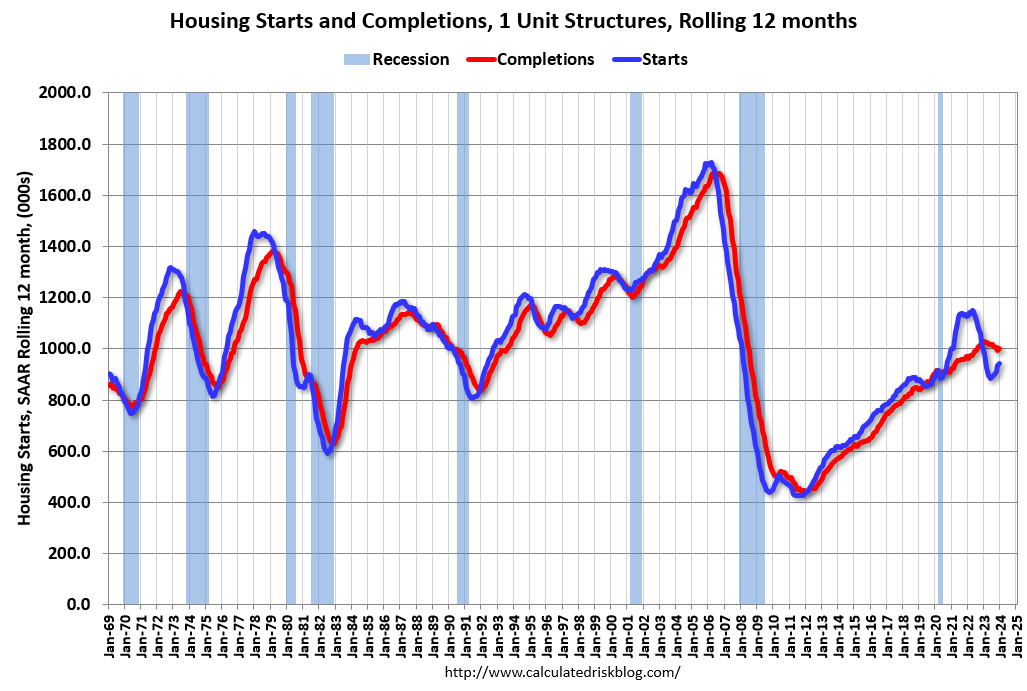
This suggests total completions will increase somewhat in 2024.
Note on Length of Time from Start to Completion
I mentioned a 17-month lag for multi-family units from start to completion, and 8-months for single family units. The source is the Census Bureau. The Census report showed construction delays in 2022, however even longer delays will show up in the 2023 data – especially for multi-family – since the data is recorded when projects are completed. This data will be released in March with the February New Residential Construction report.
In 2022, it took an average of 8.3 months from start to completion for single family homes, up from 7.2 in 2021, and up from 6.8 months in 2020. For multi-family, it took 17.0 months for buildings with 2 or more units in 2022, up from 15.4 months in 2021.
The bottom-line is we will see more multi-family completions in 2024 and overall completions will probably increase further in 2024.