CALCULATED RISK
By Bill McBride
This 2-part overview for mid-October provides a snapshot of the current housing market.
I always focus first on inventory, since inventory usually tells the tale! And currently inventory is increasing year-over-year but is still well below pre-pandemic levels.
New Listings for Existing Homes Up Year-over-year in September
Here is a graph of new listing from Realtor.com’s September 2024 Monthly Housing Market Trends Report showing new listings were up 11.6% year-over-year in September. New listings are still well below pre-pandemic levels.From Realtor.com:
Perhaps the biggest news this month is that sellers stormed back this September as newly listed homes were 11.6% above last year’s levels and a significant reversal from August’s 0.9% decrease. We noted last month that the sharp decrease in mortgage rates seen in mid-August could lead to an increase in listings in the coming months as lower rates begin to entice the marginal homeowner to sell, and that’s exactly what happened in September.
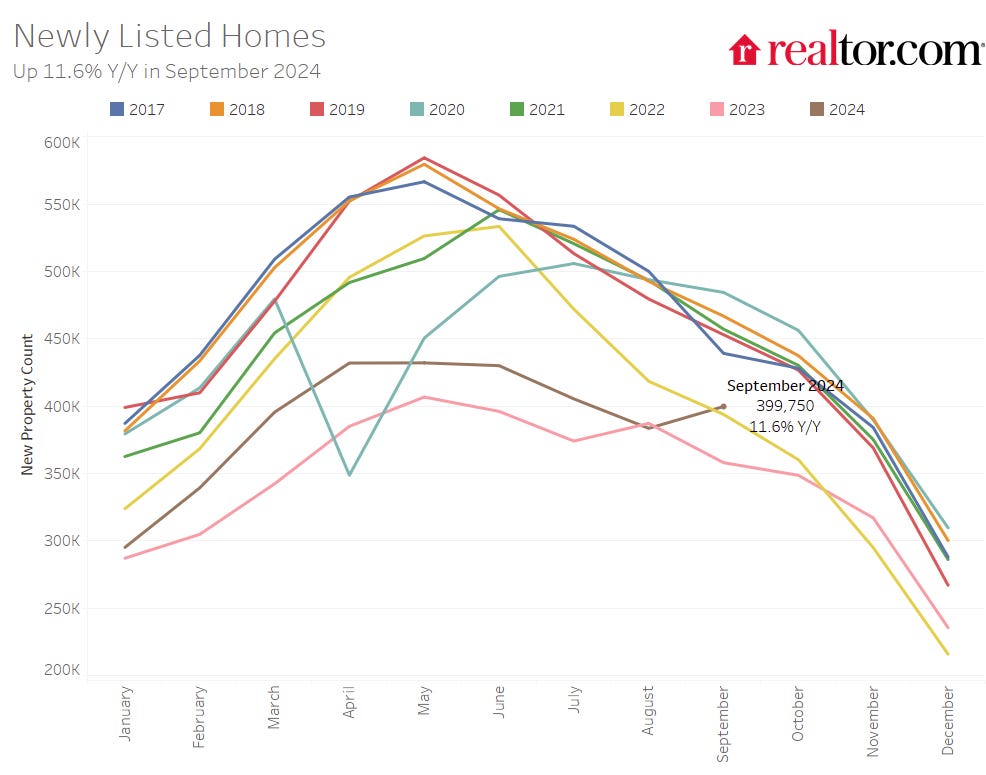
Note the seasonality for new listings. December and January are seasonally the weakest months of the year for new listings, followed by February and November. New listings will be up year-over-year in 2024, but still well below normal levels.
There are always people that need to sell due to the so-called 3 D’s: Death, Divorce, and Disease. Also, in certain times, some homeowners will need to sell due to unemployment or excessive debt. Neither is much of an issue right now, except possibly in Florida with very expensive homeowner’s insurance (due to impacts from climate change), and special assessments for condo owners due to deferred maintenance.
Hurricane Milton will depress new listings and sales in Florida this month.
And there are homeowners who want to sell for a number of reasons: upsizing (more babies), downsizing, moving for a new job, or moving to a nicer home or location (move-up buyers). It is some of the “want to sell” group that has been locked in with the golden handcuffs over the last couple of years, since it is financially difficult to move when your current mortgage rate is around 3%, and your new mortgage rate will around 6.5%.
But time is a factor for this “want to sell” group, and eventually some of them will take the plunge.
Impact on Active Inventory
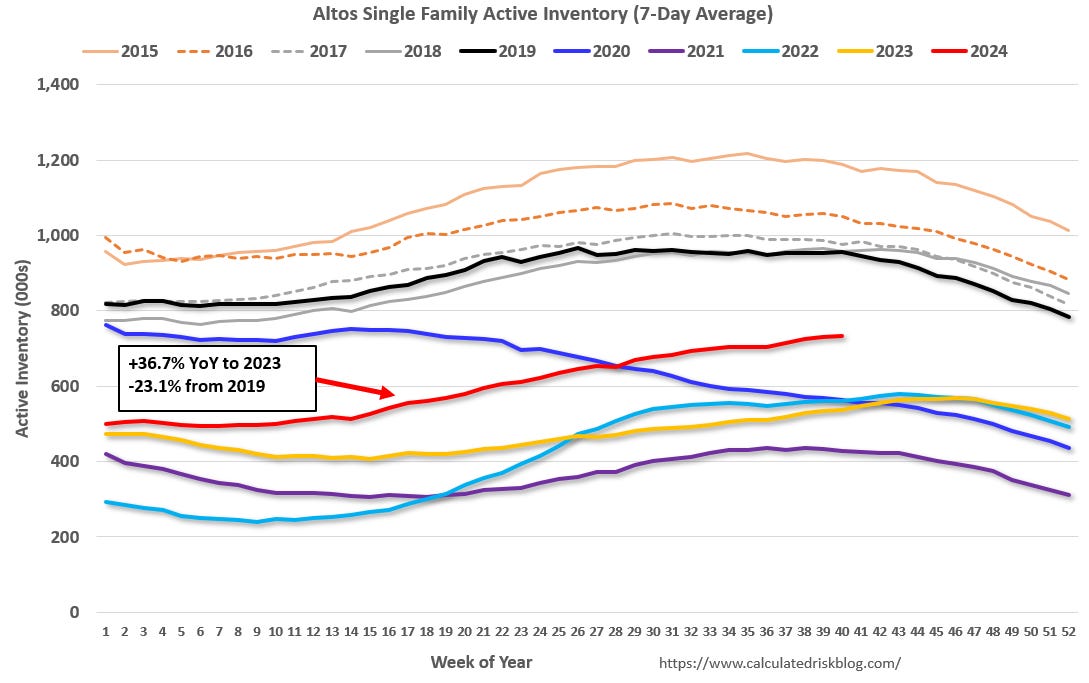
The following graph shows the seasonal pattern for active single-family inventory since 2015 through October 4, 2024, from Altos Research. The red line is for 2024. The black line is for 2019.
Inventory was up 36.7% compared to the same week in 2023 (last week it was up 36.7%), and down 23.1% compared to the same week in 2019 (last week it was down 23.4%).
Back in June 2023, inventory was down almost 54% compared to 2019, so the gap to more normal inventory levels is closing.
And here is a monthly graph of active inventory from Realtor.com. In September, active inventory was up 25.8% year-over-year.

Since both inventory and sales have fallen significant, a key for house prices is to watch months-of-supply. The following graph shows months-of-supply since 2017. Note that months-of-supply is higher than the last 5 years (2019 – 2023), and at 2017 levels. In 2020 (black), months-of-supply increased at the beginning of the pandemic and then declined sharply.
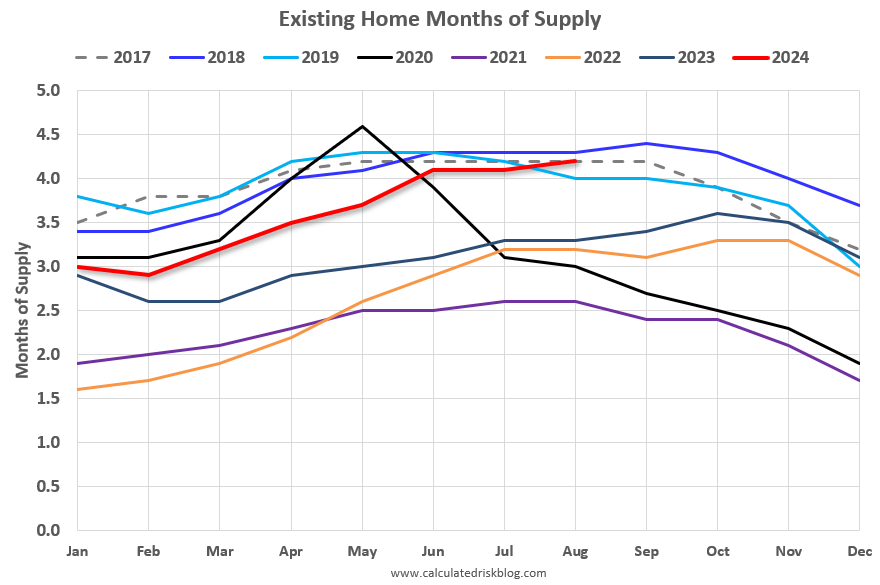
This suggests that year-over-year price growth will continue to slow. Inventory would probably have to increase to above 5 months of supply to see national price declines again.
In 2022, we saw some price declines at the National level even with fairly low months-of-supply – probably due to the sharp increase in inventory and some sellers panicking while remembering the housing bust!
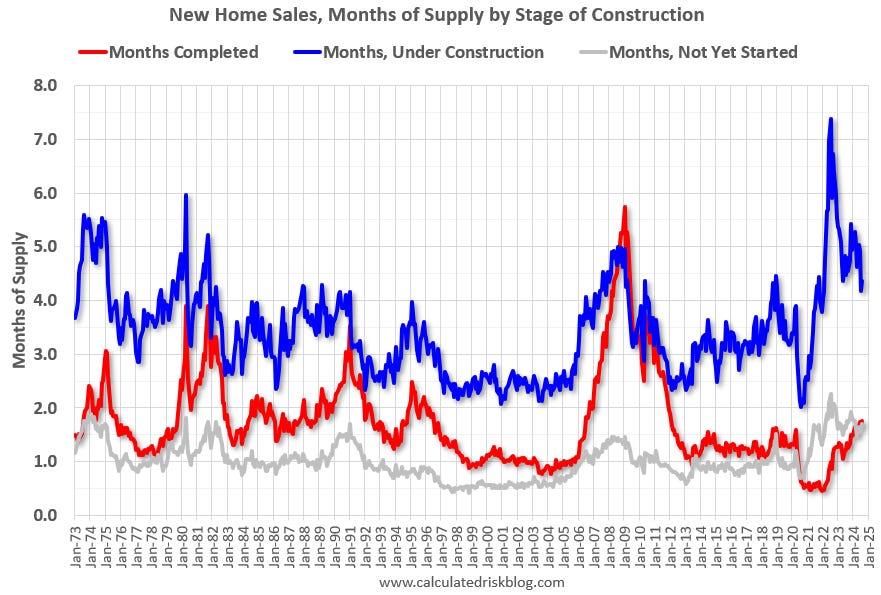
Over 4 Months of New Home Unsold Inventory Under Construction
For new homes, there are 4.4 months of homes are under construction (blue line below) – declining, but still well above the normal level. There are 1.8 months of completed supply (red line). This is slightly above the normal level.
New home inventory, as a percentage of total inventory, is still very high. The following graph uses Not Seasonally Adjusted (NSA) existing home inventory from the National Association of Realtors® (NAR) and new home inventory from the Census Bureau (only completed and under construction inventory).

It took a number of years following the housing bust for new home inventory to return to the pre-bubble percent of total inventory. Then, with the pandemic, existing home inventory collapsed and now the percent of new homes is 21.3% of the total for sale inventory, down from a peak of 27.2% in December 2022.
The percent of new homes of total inventory should continue to decline as existing home inventory increases. However, the percent of new home inventory will increase seasonally over the Winter as existing homes are withdrawn from the market.
And for housing starts there are a large number of multi-family housing units under construction, and 1.509 million total units under construction. However, multi-family housing units under construction is now declining.

Red is single family units. Currently there are 642 thousand single family units (red) under construction (SA). This was down in August compared to July, and 188 thousand below the pandemic peak in May 2022. Blue is for 2+ units. Currently there are 867 thousand multi-family units under construction. This is 154 thousand below the record set in July 2023 of 1,021 thousand.
Combined, there are 1.509 million units under construction, 202 thousand below the all-time record of 1.711 million set in October 2022.
Sales
The NAR reported sales were at a “seasonally adjusted annual rate of 3.86 million in August.” This was close to the local markets I tracked for August.

And for new home sales, the Census Bureau reported “Sales of new single-family houses in August 2024 were at a seasonally adjusted annual rate of 716,000”, down 4.7% YoY from August 2023.
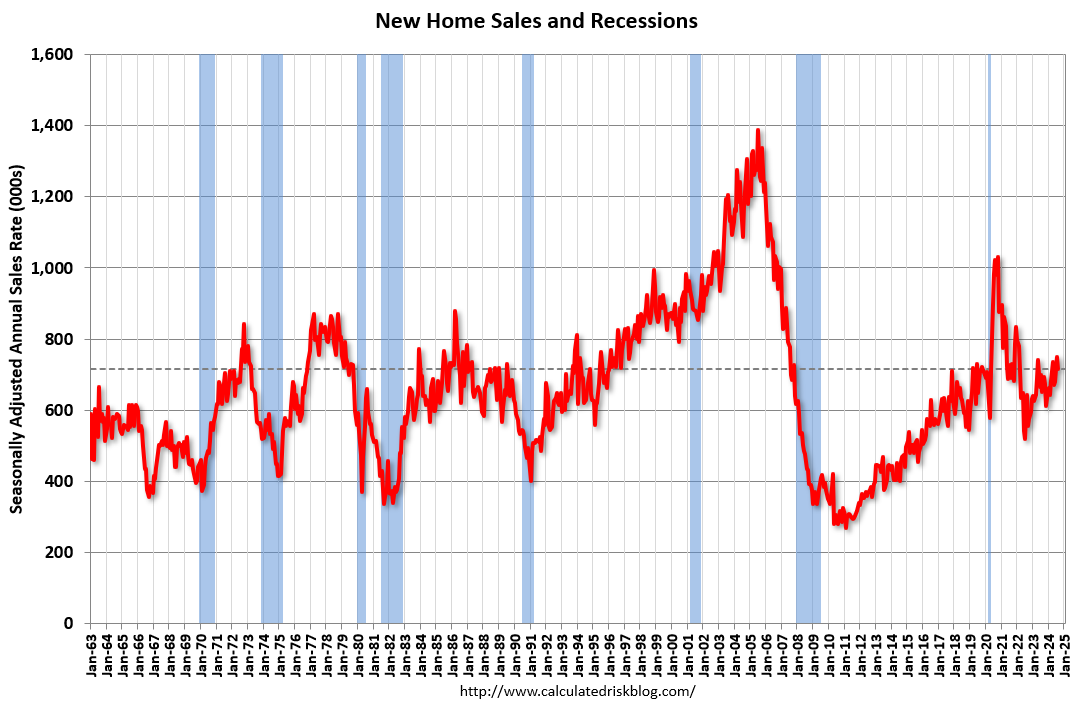
New home sales bottomed in July 2022 and new home sales have held up better than existing home sales due to the lack of existing home inventory and the lack of distressed sales this cycle – and new home builders are using various tools to attract buyers such as mortgage rate buydowns.
A key for house prices will be to watch existing home months-of-supply!
In Part 2, I’ll review house prices, rents, mortgage rates, and more.