CALCULATEDRISK
By Bill McBride
From the Census Bureau: Permits, Starts and Completions
Housing Starts:
Privately-owned housing starts in December were at a seasonally adjusted annual rate of 1,499,000. This is 15.8 percent above the revised November estimate of 1,294,000, but is 4.4 percent below the December 2023 rate of 1,568,000. Single-family housing starts in December were at a rate of 1,050,000; this is 3.3 percent above the revised November figure of 1,016,000. The December rate for units in buildings with five units or more was 418,000.
An estimated 1,364,100 housing units were started in 2024. This is 3.9 percent below the 2023 figure of 1,420,000.
Building Permits:
Privately-owned housing units authorized by building permits in December were at a seasonally adjusted annual rate of 1,483,000. This is 0.7 percent below the revised November rate of 1,493,000 and is 3.1 percent below the December 2023 rate of 1,530,000. Single-family authorizations in December were at a rate of 992,000; this is 1.6 percent above the revised November figure of 976,000. Authorizations of units in buildings with five units or more were at a rate of 437,000 in December.
An estimated 1,471,200 housing units were authorized by building permits in 2024. This is 2.6 percent below the 2023 figure of 1,511,100.
emphasis added
The first graph shows single and multi-family housing starts since 2000 (including housing bubble).
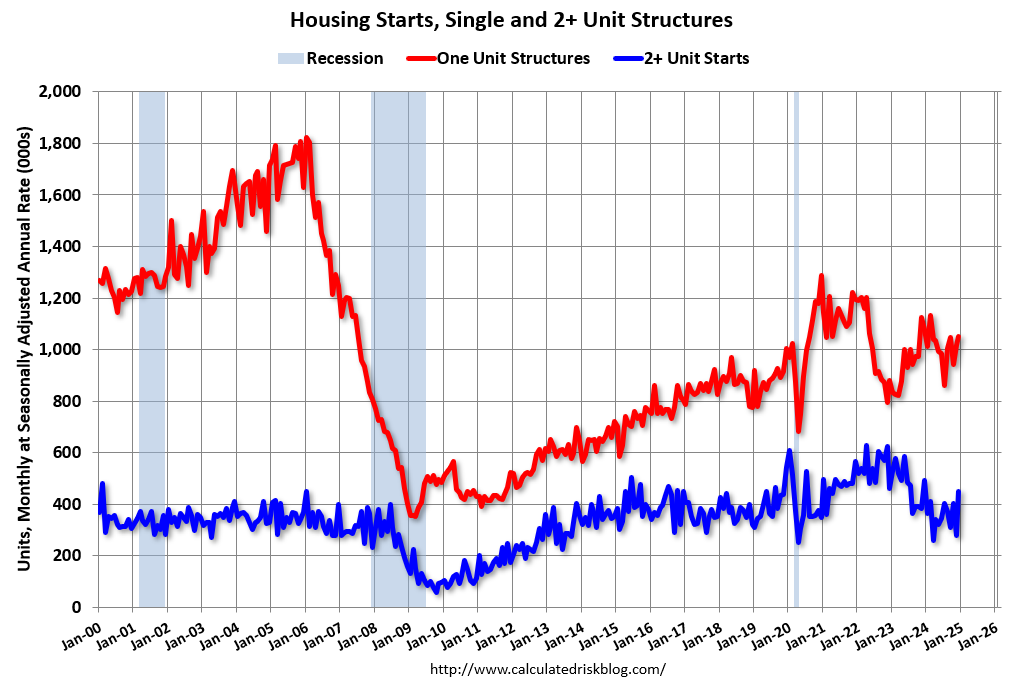
Multi-family starts (blue, 2+ units) increased month-over-month in December. Multi-family starts were down 8.4% year-over-year. Single-family starts (red) increased in December and were down 2.6% year-over-year.
Note that the weakness in 2022 and early 2023 had been in single family starts (red), then the weakness moved to multi-family. Multi-family starts might have bottomed earlier in 2024.
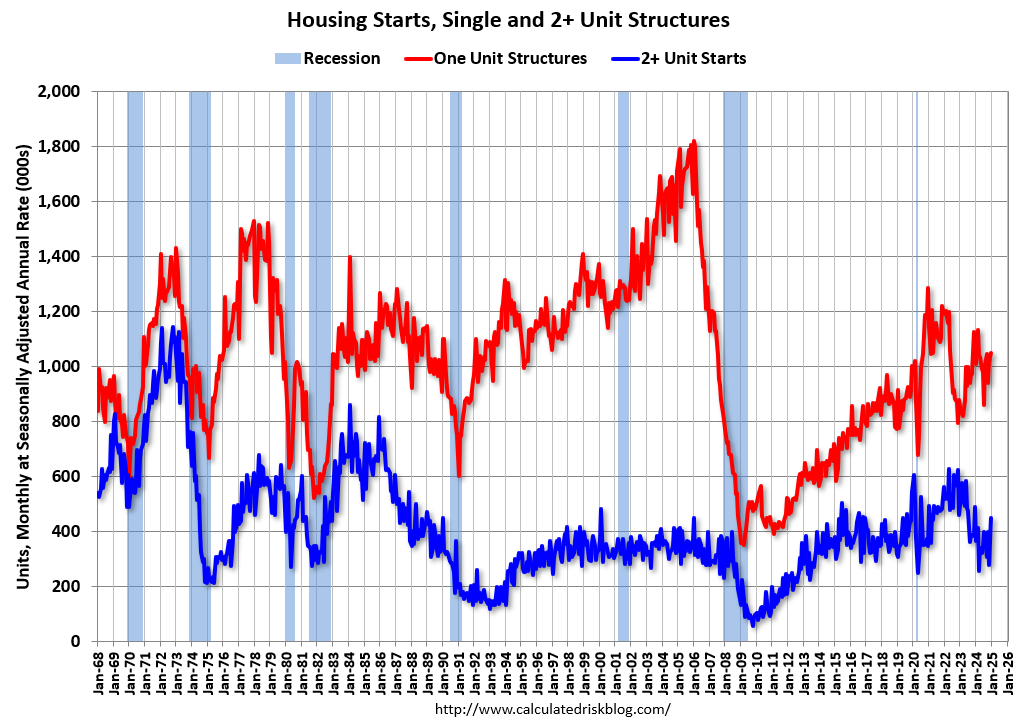
The second graph shows single and multi-family starts since 1968. This shows the huge collapse following the housing bubble, and then the eventual recovery – and the recent weakness.
Total housing starts in December were above expectations and starts in October and November were revised up.
The third graph shows the month-to-month comparison for total starts between 2023 (blue) and 2024 (red).
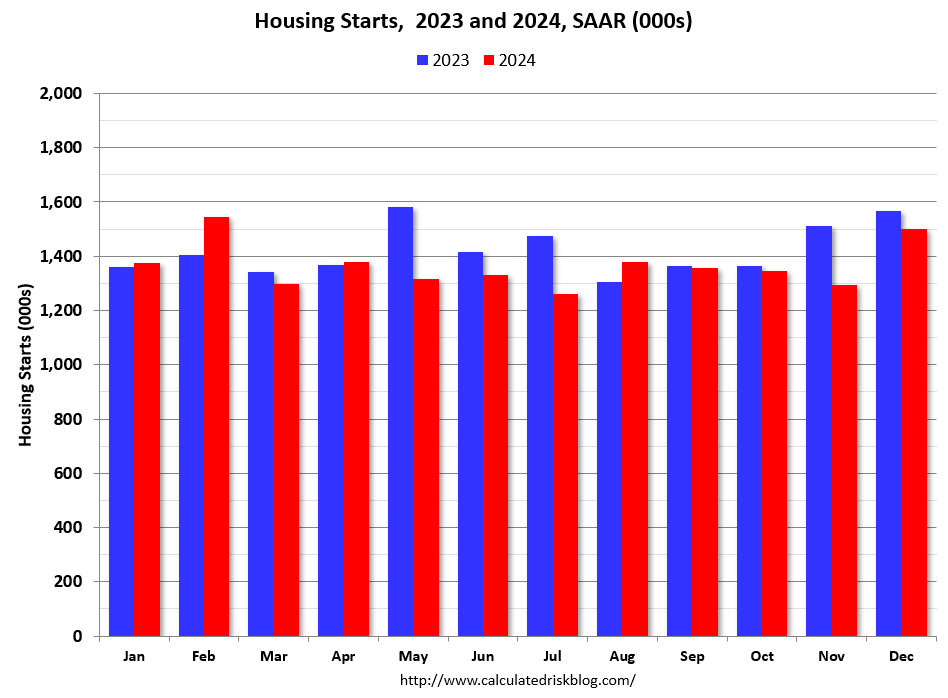
Total starts were down 4.4% in December compared to December 2023. The YoY decrease in December total starts was mostly due to a difficult comparison to starts in December 2023.
Single family starts have been up year-over-year in 13 of the last 18 months, whereas multi-family has been up year-over-year in only 3 of last 19 months. For the year, total starts were down 2.6% compared to 2023. Single family starts were up 6.6% YoY in 2024, and multi-family were down 18.8% YoY.
Multi-Family Housing Units Under Construction Continue to Decline
The fourth graph shows housing starts under construction, Seasonally Adjusted (SA).
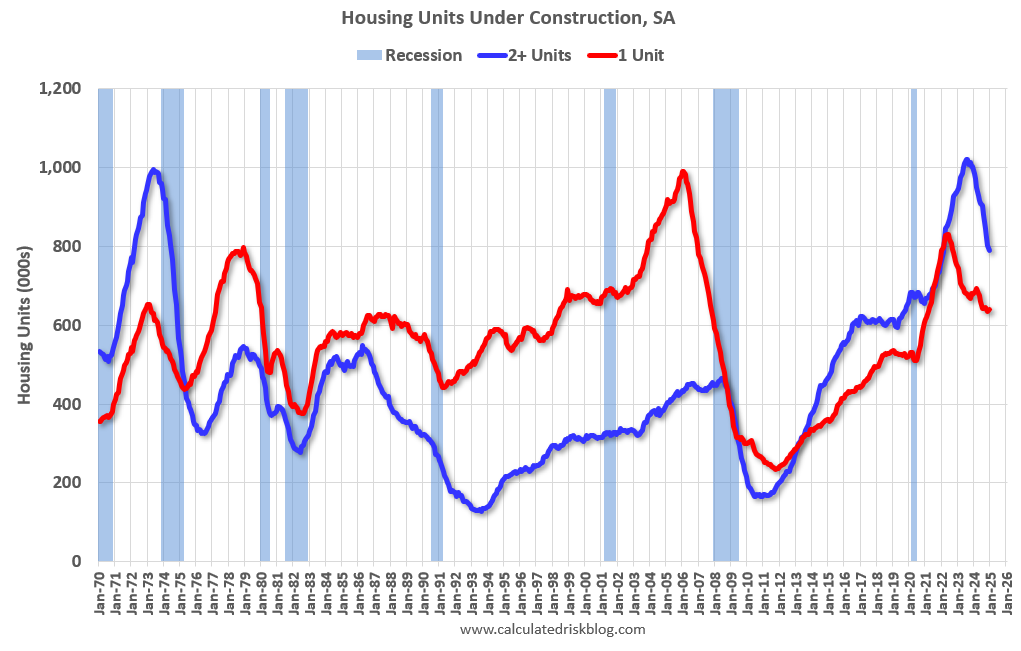
Currently there are 641 thousand single family units (red) under construction (SA). This was up slightly in December compared to November, and 189 thousand below the pandemic peak in May 2022. Single family units under construction peaked in 2022 since supply chain constraints eased.
Currently there are 790 thousand multi-family units (blue) under construction. This is 231 thousand below the record set in July 2023 of 1,021 thousand. For multi-family, construction delays had been a significant factor, but multi-family units under construction have peaked and declined significantly in 2024 – and will decline further in 2025.
Combined, there are 1.431 million units under construction, 280 thousand below the all-time record of 1.711 million set in October 2022 and the fewest since August 2021.
In the three years prior to the pandemic, there were about 1.1 to 1.2 million housing units under construction – so the current level is still historically high.
Comparing Starts and Completions
Below is a graph comparing multi-family starts and completions. Since it usually takes over a year on average to complete a multi-family project, there is a lag between multi-family starts and completions. Completions are important because that is new supply added to the market and starts are important because that is future new supply (units under construction is also important for employment).
These graphs use a 12-month rolling total for NSA starts and completions.
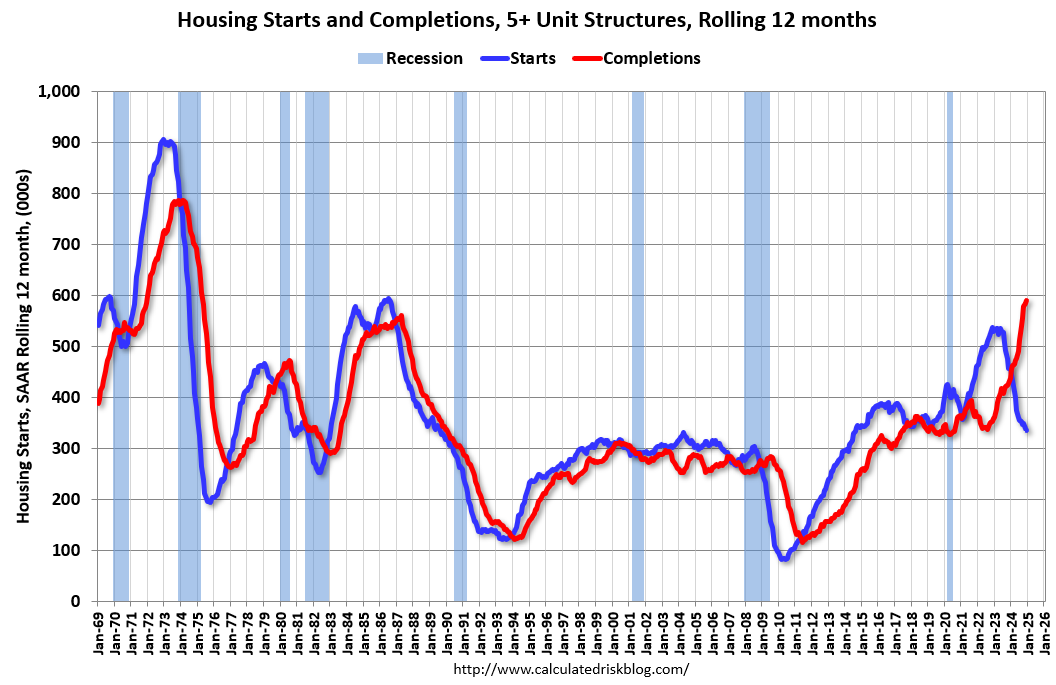
The blue line is for multifamily starts and the red line is for multifamily completions. Builders are now completing many more multifamily housing units than they are starting on a 12-month basis. Multifamily starts will likely decline a little further on a rolling 12-month basis, and completions will increase further.
The last graph shows single family starts and completions. It usually only takes about 6 months between starting a single-family home and completion – so the lines are much closer than for multi-family. The blue line is for single family starts and the red line is for single family completions.
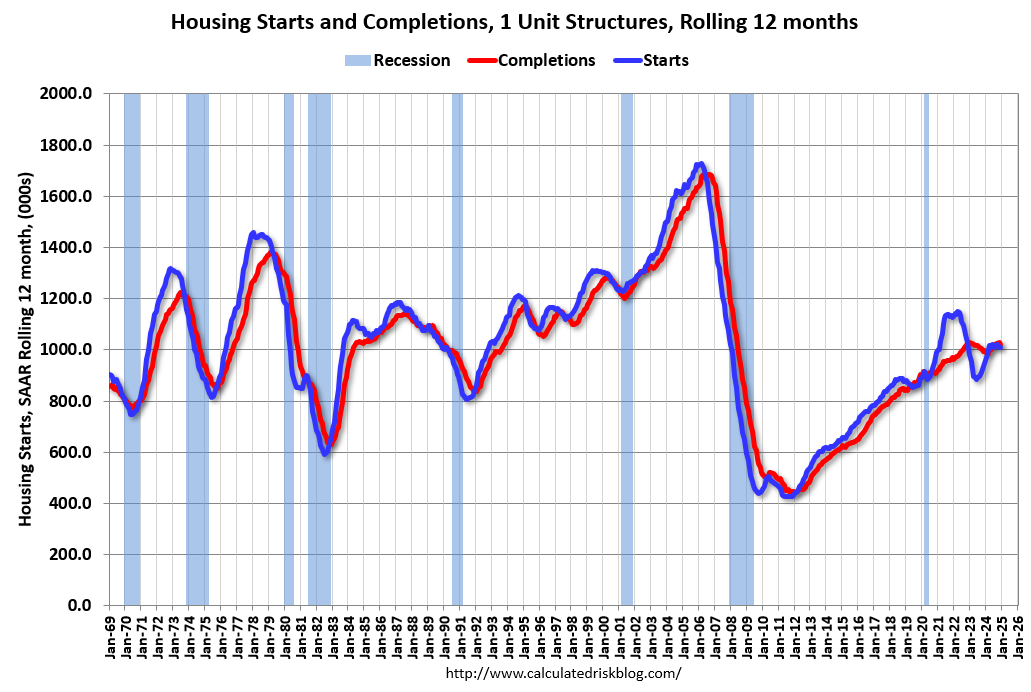
Builders are now starting about the same number of single-family homes as they are completing on a 12-month basis.
Conclusions
Total housing starts in December were above expectations and starts in October and November were revised up. A solid report.
The expected weakness in multi-family starts began in 2023 and it appears multi-family starts are at a bottom.
I’ve been watching leading indicators, such as the National Multifamily Housing Council’s (NMHC’s) Quarterly Survey of Apartment Market Conditions and the Architectural Billings Index (ABI) for signs of a pickup in the multi-family sector. The ABI for multi-family turned slightly positive in November suggesting design services for multi-family might be bottoming. This suggests we will see further weakness in multi-family starts, but a possible pickup in the 2nd half of 2025.