CALCULATEDRISK
By Bill McBride
From the Census Bureau: Permits, Starts and Completions
Housing Starts:
Privately-owned housing starts in April were at a seasonally adjusted annual rate of 1,361,000. This is 1.6 percent above the revised March estimate of 1,339,000, but is 1.7 percent below the April 2024 rate of 1,385,000. Single-family housing starts in April were at a rate of 927,000; this is 2.1 percent below the revised March figure of 947,000. The April rate for units in buildings with five units or more was 420,000.
Building Permits:
Privately-owned housing units authorized by building permits in April were at a seasonally adjusted annual rate of 1,412,000. This is 4.7 percent below the revised March rate of 1,481,000 and is 3.2 percent below the April 2024 rate of 1,459,000. Single family authorizations in April were at a rate of 922,000; this is 5.1 percent below the revised March figure of 972,000. Authorizations of units in buildings with five units or more were at a rate of 431,000 in April.
emphasis added
The first graph shows single and multi-family housing starts since 2000 (including housing bubble).
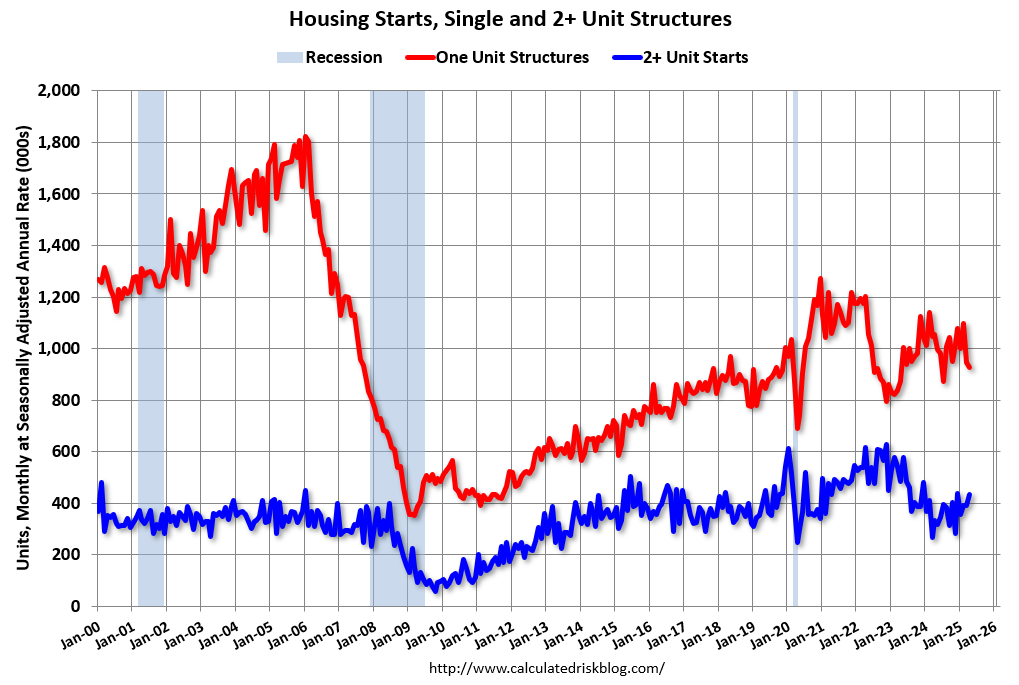
Multi-family starts (blue, 2+ units) increased month-over-month in April. Multi-family starts were up sharply year-over-year. Single-family starts (red) decreased in April and were down 12.0% year-over-year.
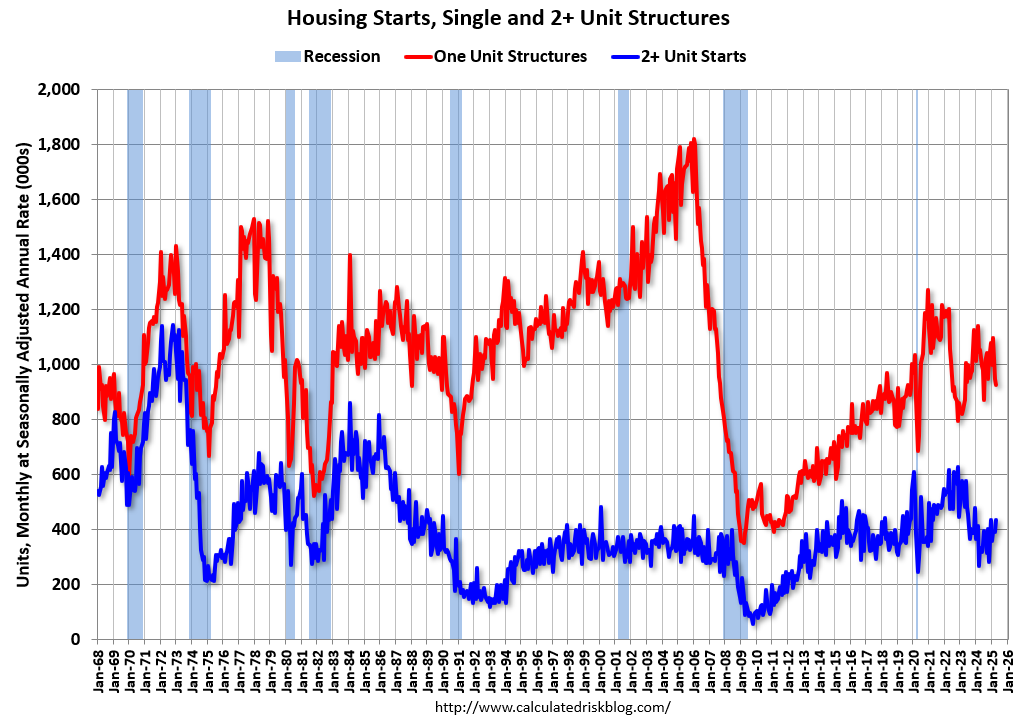
The second graph shows single and multi-family starts since 1968. This shows the huge collapse following the housing bubble, and then the eventual recovery.
Total housing starts in April were at expectations and starts in February and March were revised up, combined.
The third graph shows the month-to-month comparison for total starts between 2024 (blue) and 2025 (red).
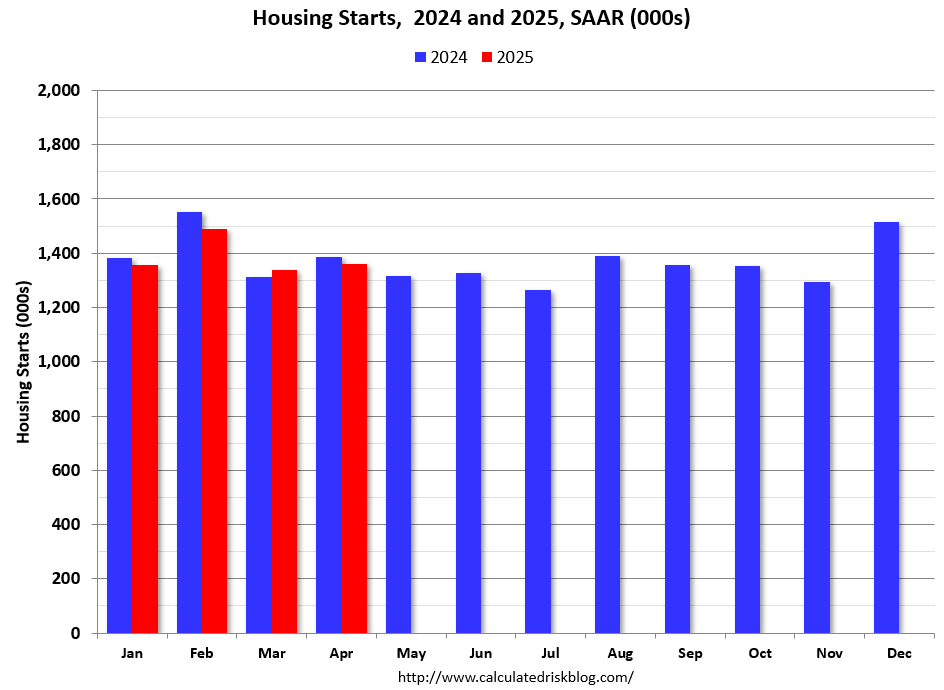
Total starts were down 1.7% in April compared to April 2024. Year-to-date (YTD) starts are down 1.6% compared to the same period in 2024. Single family starts are down 7.1% YTD and multi-family up 13.4% YTD.
Multi-Family Housing Units Under Construction Remains Elevated
The fourth graph shows housing starts under construction, Seasonally Adjusted (SA).
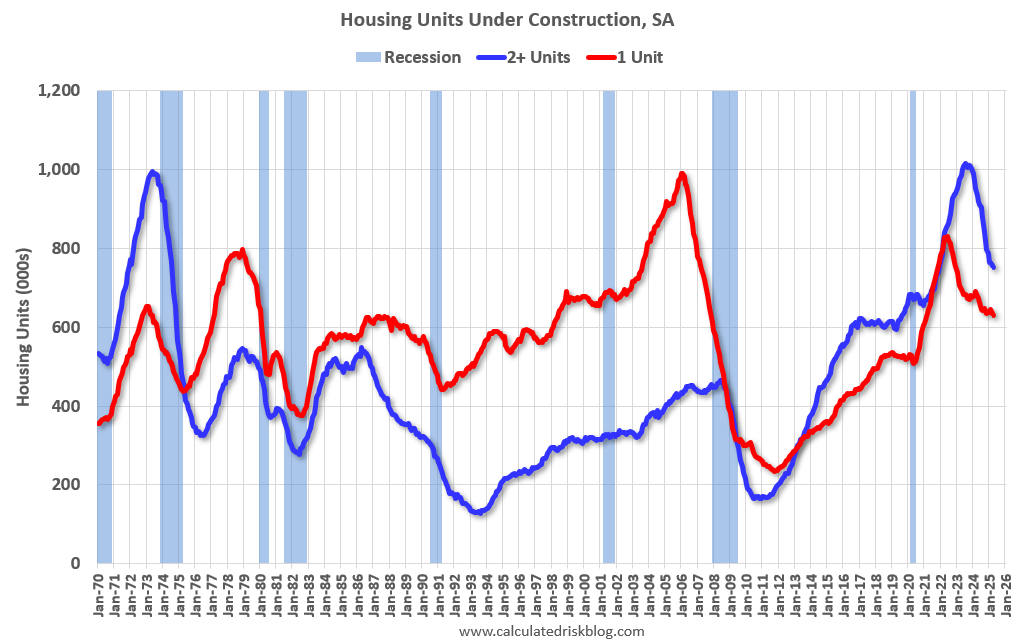
Currently there are 630 thousand single family units (red) under construction (SA). This was down in April compared to March, and 200 thousand below the pandemic peak in June 2022. Single family units under construction peaked in 2022 as supply chain constraints eased.
Currently there are 752 thousand multi-family units (blue) under construction. This was down from 756 thousand in March. This is 264 thousand below the record set in July 2023 of 1,016 thousand. For multi-family, construction delays had been a significant factor, but multi-family units under construction have peaked and declined significantly in 2024 – and will decline further in 2025.
Combined, there are 1.382 million units under construction, 333 thousand below the all-time record of 1.715 million set in October 2022.
In the three years prior to the pandemic, there were about 1.1 to 1.2 million housing units under construction – so the current level is still historically high. And there will likely be a decline in demand in 2025.
Comparing Starts and Completions
Below is a graph comparing multi-family starts and completions. Since it usually takes over a year on average to complete a multi-family project, there is a lag between multi-family starts and completions. Completions are important because that is new supply added to the market and starts are important because that is future new supply (units under construction is also important for employment).
These graphs use a 12-month rolling total for NSA starts and completions.
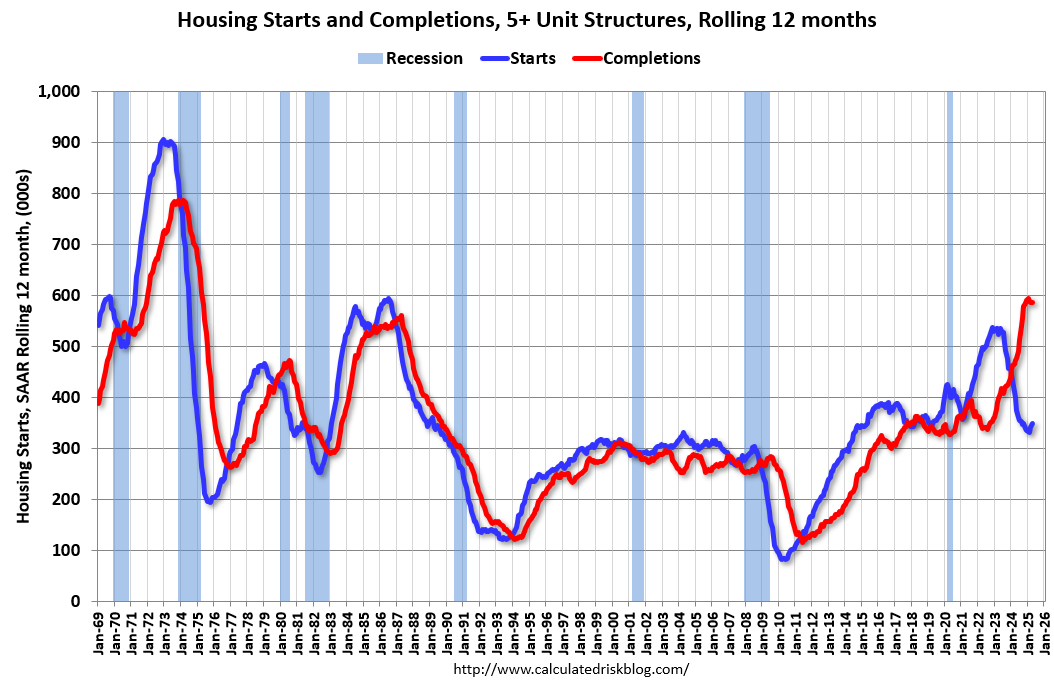
The blue line is for multifamily starts and the red line is for multifamily completions. Builders are now completing many more multifamily housing units than they are starting on a 12-month basis. Multifamily starts might have bottomed on a rolling 12-month basis, and completions have topped.
The last graph shows single family starts and completions. It usually only takes about 6 months between starting a single-family home and completion – so the lines are much closer than for multi-family. The blue line is for single family starts and the red line is for single family completions.
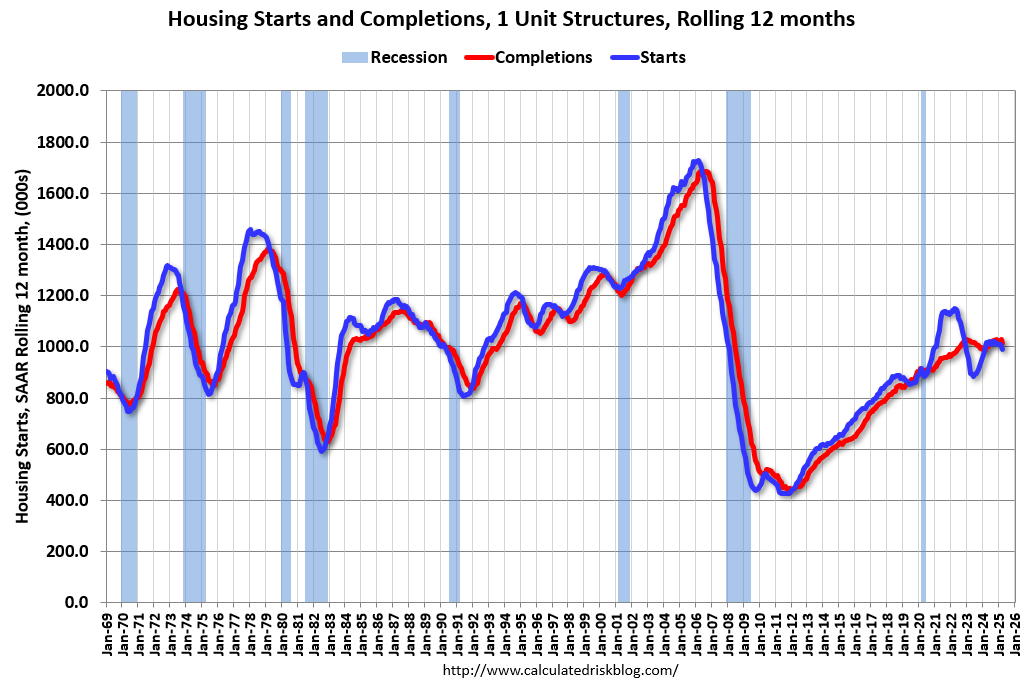
Builders are now starting about the same number of single-family homes as they are completing on a 12-month basis.
Conclusions
Total housing starts in April were at expectations and starts in February and March were revised up, combined. Note that permits declined in April compared to March.
It appears demand is weakening due to policy, and this will push down starts in 2025.
For multi-family, I’ve been watching leading indicators, such as the National Multifamily Housing Council’s (NMHC’s) Quarterly Survey of Apartment Market Conditions (“This index has been an excellent leading indicator for rents and vacancy rates, and this suggests vacancy rates and asking rents might have stabilized following ten consecutive quarters with looser conditions than the previous quarter.) and the Architectural Billings Index (ABI) for signs of a pickup in the multi-family sector. The ABI for multi-family “Multi-family billings remained negative has been negative for the last 32 months.” This suggests the recent pickup in multi-family starts might not last.
For single family starts, yesterday the NAHB reported:
“The spring home buying season has gotten off to a slow start as persistent elevated interest rates, policy uncertainty and building material cost factors hurt builder sentiment in May,” said NAHB Chairman Buddy Hughes, a home builder and developer from Lexington, N.C. “However, the overwhelming majority of survey responses came before the tariff reduction announcement with China. Builders expect future trade negotiations and progress on tax policy will help stabilize the economic outlook and strengthen housing demand.”
“Policy uncertainty stemming in large part from the stop-and-start tariff issues has hurt builder confidence but the initial trade arrangements with the United Kingdom and China are a welcome development,” said NAHB Chief Economist Robert Dietz. “Still, the overall actions on tariffs in recent weeks have had a negative impact on builders, as 78% reported difficulties pricing their homes recently due to uncertainty around material prices.”
emphasis added
Policy will likely negatively impact single family starts in 2025.