CALCULATEDRISK
By Bill McBride
Last week, in Part 1: Current State of the Housing Market; Overview for mid-September 2025 I reviewed home inventory, housing starts and sales. I noted that the key stories this year for existing homes are that inventory increased sharply, and sales are down slightly year-to-date compared to last year (and sales in 2024 were the lowest since 1995). That means prices are under pressure.
In Part 2, I will look at house prices, mortgage rates, rents and more.
As I noted last week, the house price trend suggests house prices will be down year-over-year by the end of 2025. However, there are two new powerful forces pushing in opposite directions – mortgage rates have declined, and unemployment is increasing. Both could impact sales and house prices.
Earlier in the week, Cotality’s Chief Economist Dr. Selma Hepp (formerly CoreLogic) wrote: “July’s decline in home prices is atypical — the last two periods where we saw monthly declines in July was in 2022 and during 2006-2008 period …” In 2022, house prices fell briefly as mortgage rates surged higher, and inventory increased sharply. And the 2006-2008 period was the start of the housing bust.
House Prices
The Case-Shiller National Index increased 1.9% year-over-year (YoY) in June and will likely be lower year-over-year in the July report compared to June (based on other data).
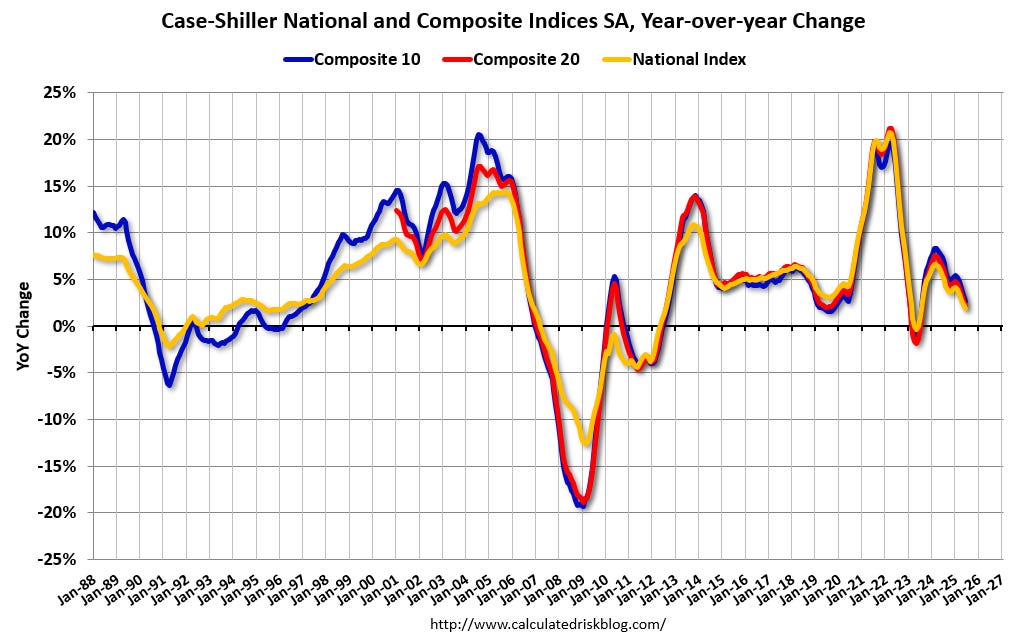
The Composite 10 NSA was up 2.6% year-over-year. The Composite 20 NSA was up 2.1% year-over-year. The National index NSA was up 1.9% year-over-year.
The MoM decrease in the seasonally adjusted (SA) Case-Shiller National Index was at -0.26% (a -3.1% annual rate). This was the fourth consecutive MoM decrease.
In the January report, the Case-Shiller National index was up 4.2%, in February up 3.9%, in March up 3.4%, in April report up 2.7%, in May up 2.3% and in June up 1.9%.
And the June Case-Shiller index was a 3-month average of closing prices in April, May and June. April closing prices include some contracts signed in February.
So, not only is this trending down, but there is a significant lag to this data.
Let’s review some more timely house price data …
Other measures of house prices suggest prices will be up a less YoY in the July Case-Shiller index as in the June report. The NAR reported median prices were up 0.2% YoY in July, down from 1.4% YoY in June. (Note that median prices are impacted by the mix).
ICE reported prices were up 1.1% YoY in August, unchanged from 1.1% YoY in July. Freddie Mac reported house prices were up 1.4% YoY in July, down from 1.8% YoY in June.
Here is a comparison of year-over-year change in the FMHPI, median house prices from the NAR, and the Case-Shiller National index.

The FMHPI and the NAR median prices appear to be leading indicators for Case-Shiller. Based on recent monthly data, and the FMHPI, the YoY change in the Case-Shiller index will likely be lower in July than in June.
In real terms, the Case-Shiller National index is down 2.5% from the peak in 2022, seasonally adjusted. It has now been 37 months since the real peak in house prices. Typically, after a sharp increase in prices, it takes a number of years for real prices to reach new highs.

Both the real National index and the Comp-20 index decreased in June.
30-Year Mortgage Rates at 11 Month Lows
The following graph from MortgageNewsDaily.com shows mortgage rates since January 1, 2000. 30-year mortgage rates were at 6.27% on September 11th. This is the lowest 30-year rate since early October 2024.
Mortgage rates were low following the financial crisis through the early years of the pandemic. Now rates have returned to a new normal in 30-year mortgage rates in the 6% to 7% range.
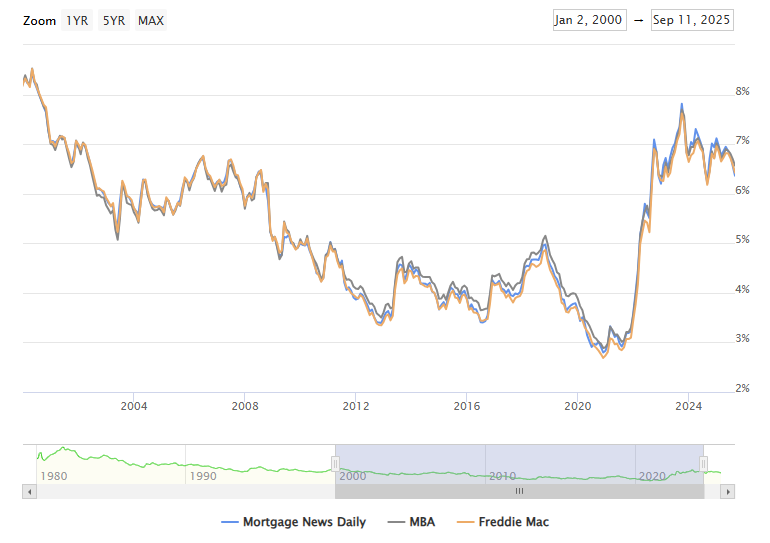
A year ago, 30-year mortgage rates were at 6.11%, two years ago rates were at 7.30%, three years ago rates at 5.98%, and four years ago at 2.94%.
It is financially very difficult for homeowners to move and give up their 3% mortgage rates, however time and life changes are slowing leading to more listings.
Note that rates were falling in 2019 – into the high 3s – prior to the pandemic as the economy weakened in 2019.
Mortgage Purchase Applications Have Increased
Here is a graph showing the MBA mortgage purchase index released last week. Purchase application activity is up from the lows in late October 2023 and is above the lowest levels during the housing bust.
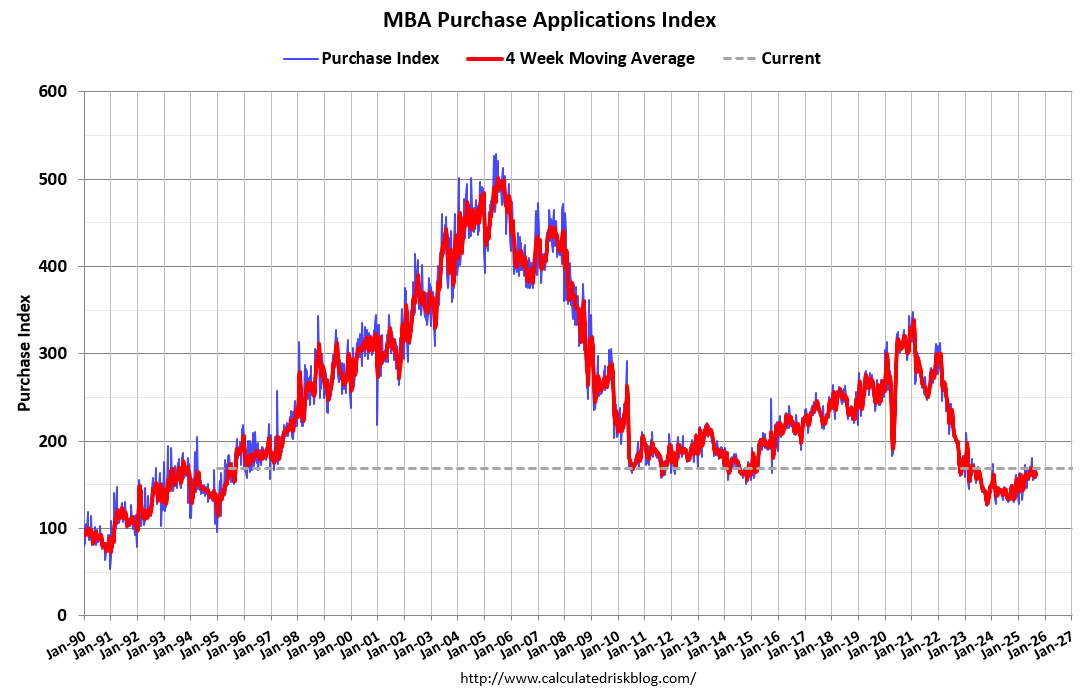
This is still very low.
And the next graph shows the refinance index since 1990. Refinance activity is still very low but picking up a little with lower mortgage rates.
Many of the homebuyers in the last few years might be able to refinance now.

Asking Rents Mostly Unchanged Year-over-year
Here is a graph of the year-over-year (YoY) change for these measures since January 2015. Most of these measures are through July 2025, except Apartment List through August 2025.

The Zillow measure (single and multi-family) is up 2.6% YoY in July, down from 2.9% YoY in June, and down from a peak of 15.6% YoY in February 2022.
The ApartmentList measure is -0.9% YoY as of August, down from -0.8% in July, and down from a peak of 17.8% YoY December 2021.
Asking rents are mostly unchanged YoY for multi-family and with new supply coming on the market (although at a lower level than last year), we will likely see continued pressure on asking rents.
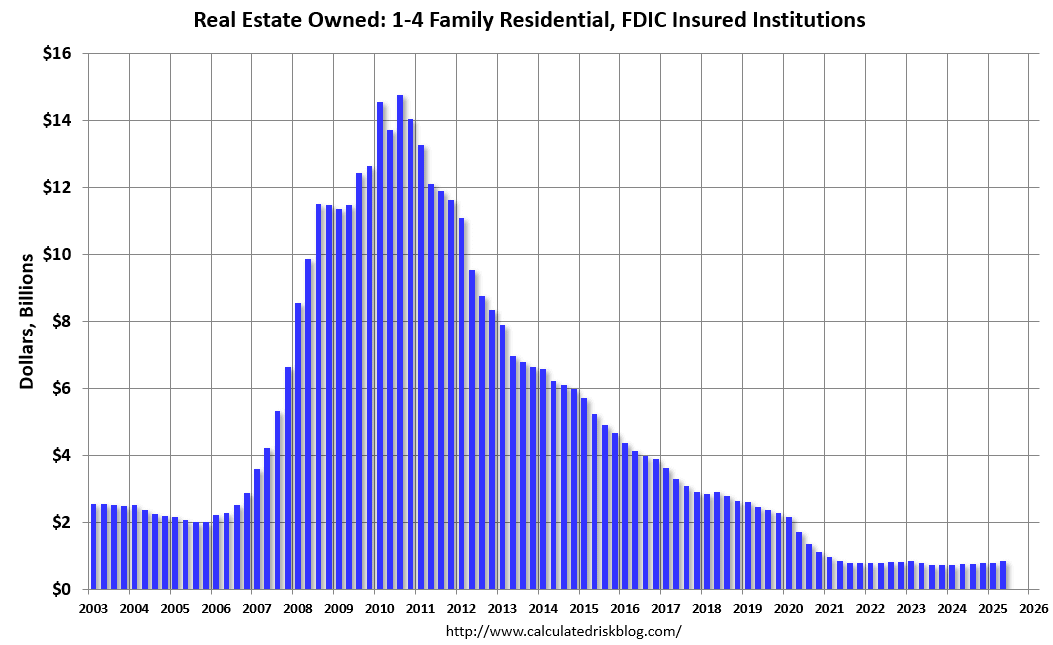
Delinquencies and Foreclosures Remain Low
This graph shows the nominal dollar value of Residential REO for FDIC insured institutions based on the Q2 FDIC Quarterly Banking Profile released last week. Note: The FDIC reports the dollar value and not the total number of REOs.
The dollar value of 1-4 family residential Real Estate Owned (REOs, foreclosure houses) was up 15% YOY from $766 million in Q2 2024 to $852 million in Q2 2025. This is still historically extremely low.
Fannie Mae reported the number of REOs decreased to 4,666 at the end of Q2 2025, down 11% from 5,236 at the end of the previous quarter, and down 35% year-over-year from 7,179 in Q2 2024. Here is a graph of Fannie Real Estate Owned (REO).

This is very low and well below the pre-pandemic levels. REOs are a lagging indicator. REOs increase when borrowers struggle financially and have little or no equity, so they can’t sell their homes – as happened after the housing bubble. That will not happen this time.