CALCULATEDRISK
By Bill McBride
This 2-part overview for mid-January provides a snapshot of the current housing market.
Note that we are still missing some key pieces of data due to the government shutdown, such as housing starts and new home sales for November.
The key stories this year for existing homes are that inventory increased sharply (almost back to pre-pandemic levels), and sales in 2025 were the lowest since 1995 (slightly lower than in 2024). That means prices are under pressure, although there will not be a huge wave of distressed sales since most homeowners have substantial equity and low mortgage rates.
It has also been a disappointing year for new homebuilders (but not as horrible as the housing bust!). Homebuilders have a large number of completed homes for sales, a larger than normal number of unsold homes under construction and are reducing prices to compete with more existing home inventory.
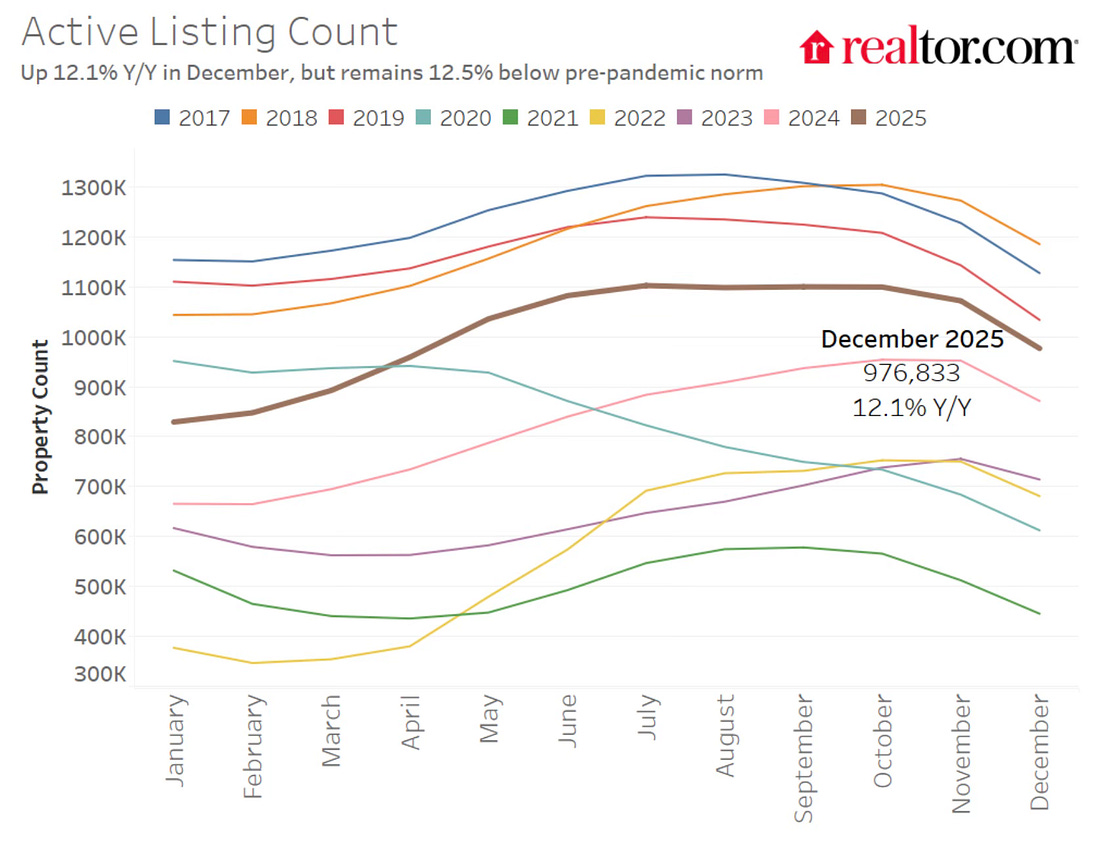
Active Listings for Existing Homes Up Year-over-year
Realtor.com reports in the December 2025 Monthly Housing Market Trends Report that new listings were up 1.7% year-over-year in December. And active listings were up 12.1% year-over-year.
The number of actively listed homes rose 12.1% compared to the same time last year, marking the 26th consecutive month of year-on-year inventory gains. On a monthly basis, active inventory fell 8.9% since November (a typical seasonal pattern), falling below 1 million homes for the first time since April. December’s 12.1% YoY gain also means annual active listing growth has slowed in each of the last 7 months (down from ~30% peak YoY growth in May and June). Nationwide, December inventory is 12.5% below typical 2017–2019 levels, a similar level to each of the past several months.
Note the seasonality for active listings. Also, there are significant differences in inventory year-over-year (YoY) and month-over-month (MoM) between sources. Here are the numbers through December:
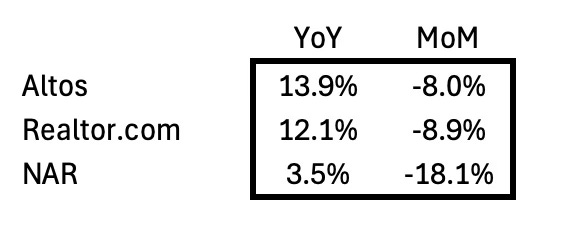
The NAR has changed when they report – much earlier in the month than previous years – and perhaps there was a change in methodology. It is also possible with the earlier reporting cycle, some sources had errors in their inventory data.
I’m looking into these differences.
Here is some more data on supply and sales.
The following graph shows the seasonal pattern for active single-family inventory since 2015 through January 9, 2026, from Altos Research. The red line is for 2026. The black line is for 2019.
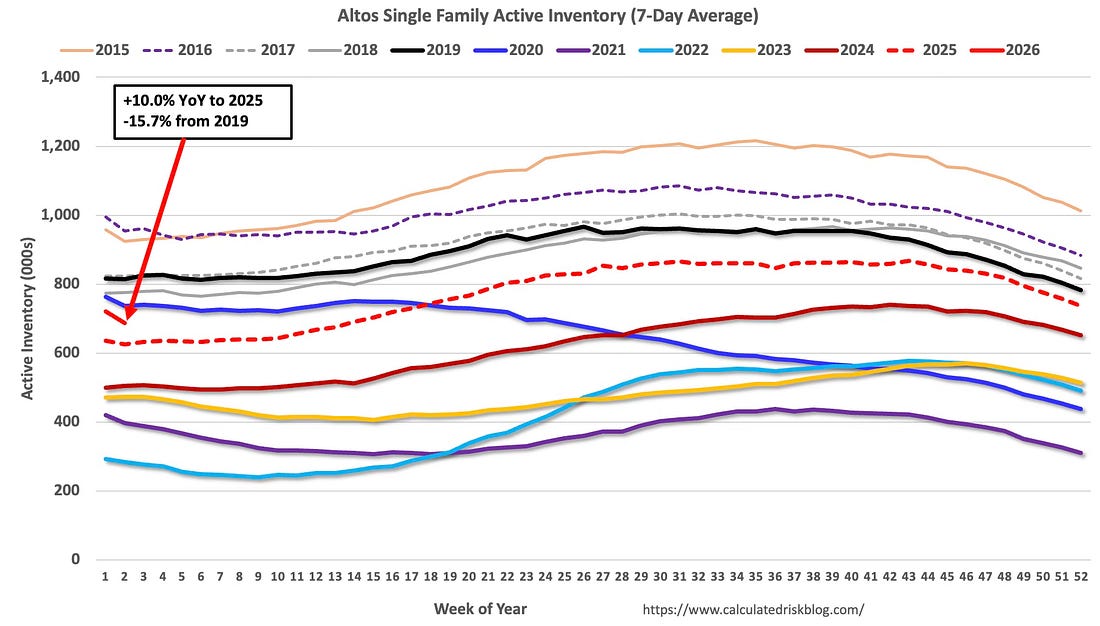
Inventory was up 10.0% compared to the same week in 2025, and down 15.7% compared to the same week in 2019. Inventory is getting closer to pre pandemic levels, but is still below 2019 levels at the beginning of 2026.
Months-of-Supply
Since inventory has increased and sales have been flat year-over-year, a key for house prices is to watch months-of-supply. The following graph shows months-of-supply since 2017 using data from the NAR. Note that months-of-supply is higher than 7 of the previous 8 years!
Months-of-supply was at 3.3 months in December compared to 3.0 months in December 2019. National months-of-supply is now above pre-pandemic levels.
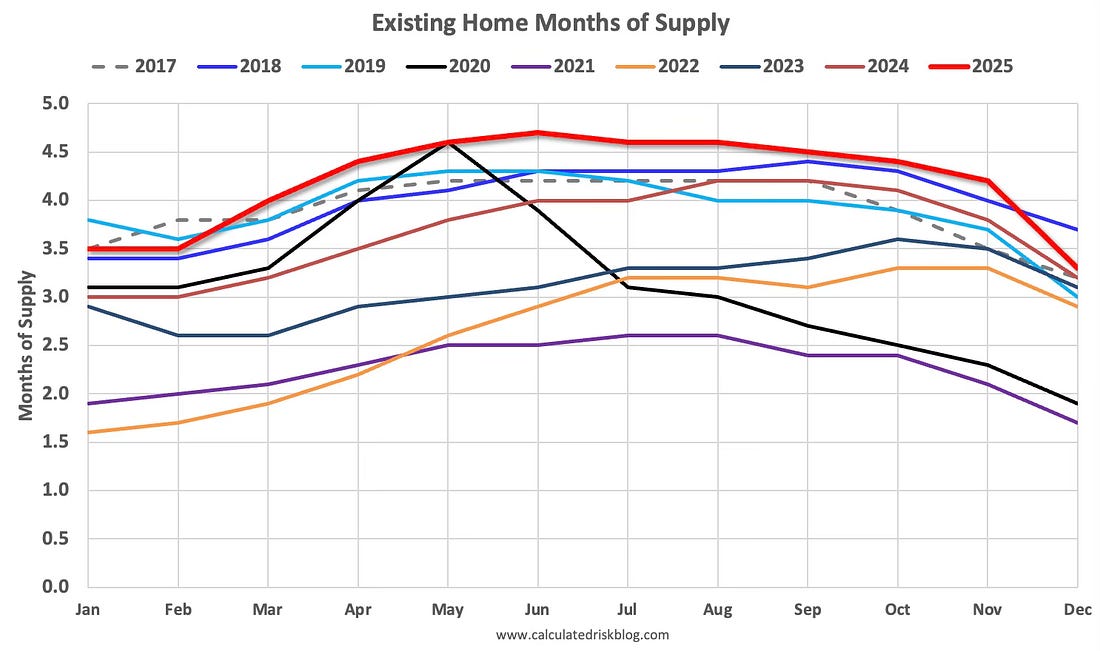
In 2022, we saw some price declines at the National level even with fairly low months-of-supply – probably due to the sharp increase in inventory and some sellers panicking while remembering the housing bust!
Over 4 Months of Unsold Inventory Under Construction
For new homes, there are over 4 months of homes are under construction (see blue line below), well above the normal levels..
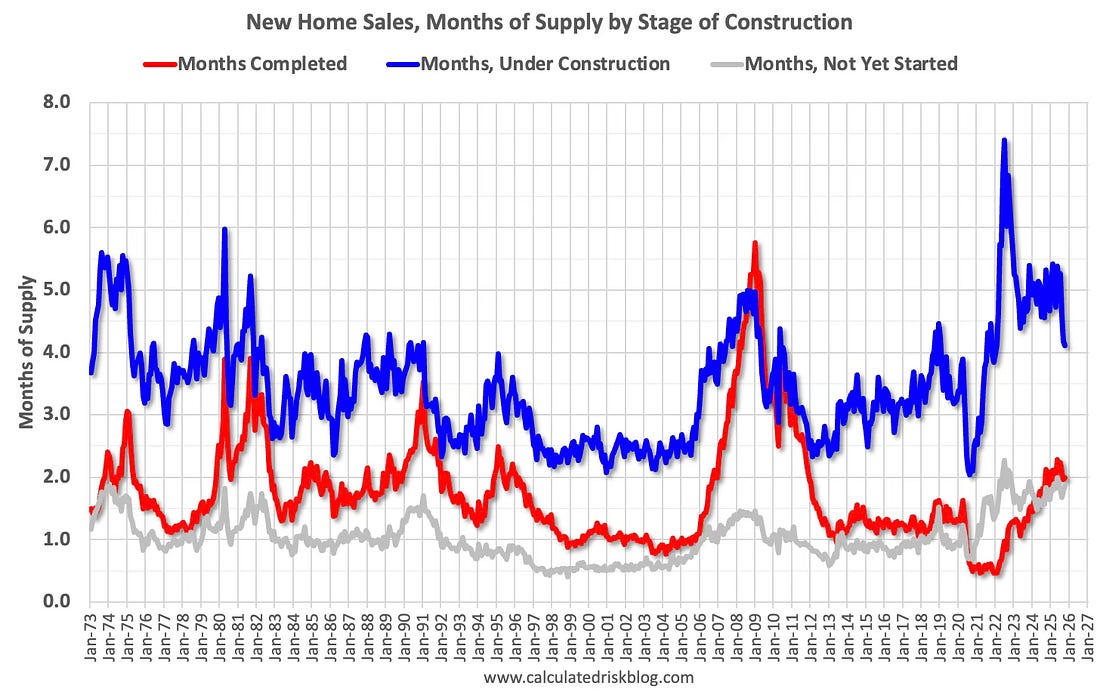
There are 2.0 months of completed supply (red line). This is above the normal level.
The inventory of new homes under construction is at 4.1 months (blue line). This has declined from 7.4 months in July 2022 but is still a larger than normal number of homes under construction.
And 1.9 months of potential inventory that have not been started (grey line) – above the normal level. Homebuilders are probably waiting to start some homes until they clear more inventory, and have a firmer grasp on prices, mortgage rates and demand.
New home inventory, as a percentage of total inventory, is still very high. The following graph uses Not Seasonally Adjusted (NSA) existing home inventory from the National Association of Realtors® (NAR) and new home inventory from the Census Bureau (only completed and under construction inventory).
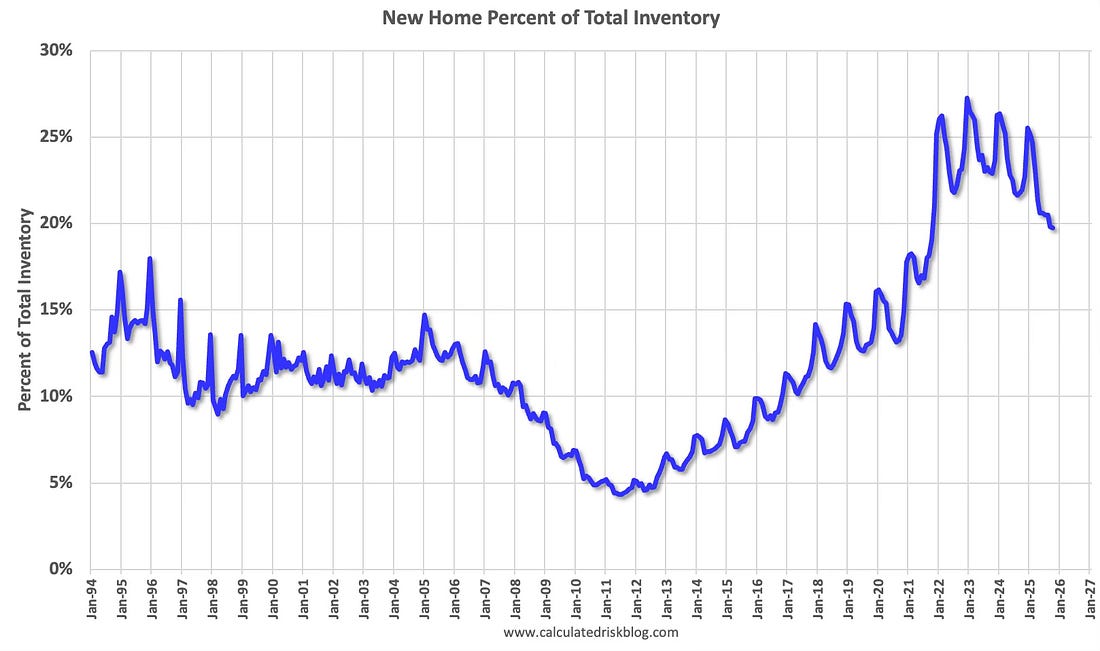
NOTE: This is only through October since new home data for November and December is not available yet.
It took a number of years following the housing bust for new home inventory to return to the pre-bubble percent of total inventory. Then, with the pandemic, existing home inventory collapsed and now the percent of new homes is 19.7% of the total for sale inventory, down from 21.9% a year ago in October 2024, and down from a peak of 27.3% in December 2022.
The percent of new homes of total inventory should continue to decline as existing home inventory increases (with seasonal swings).
And for housing starts there are still an above normal number of multi-family housing units under construction, and 1.315 million total units under construction.
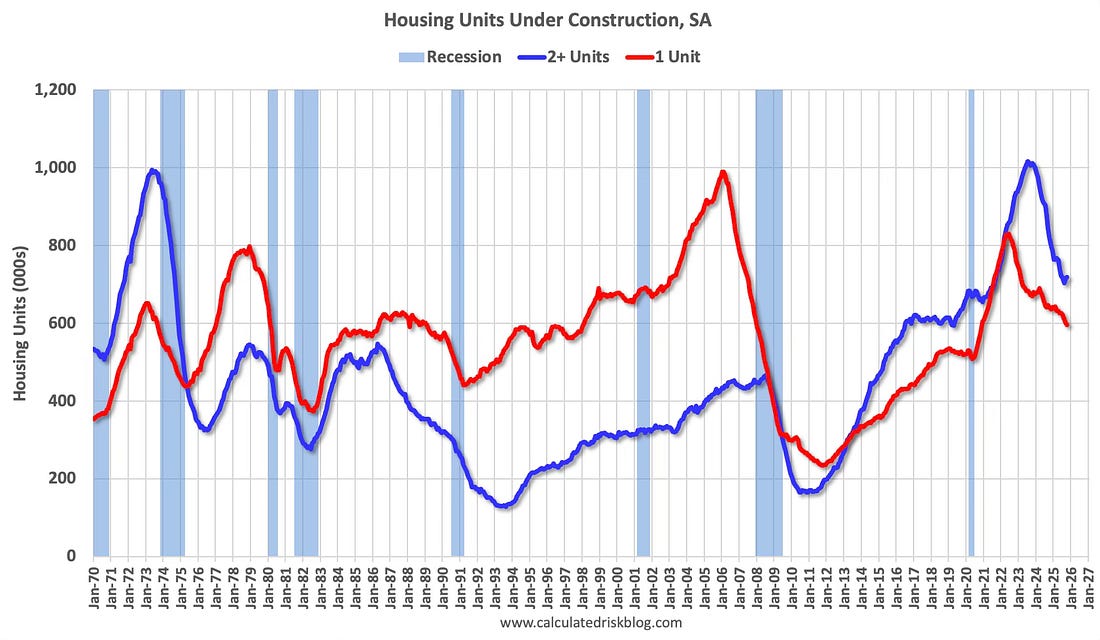
Currently there are 596 thousand single family units (red) under construction (SA). This was down in October compared to September, and 234 thousand below the pandemic peak in June 2022.
Currently there are 719 thousand multi-family units (blue) under construction. This was up from 716 thousand in September. This is 297 thousand below the record set in July 2023 of 1,016 thousand.
Combined, there are 1.315 million units under construction, 400 thousand below the all-time record of 1.715 million set in October 2022.
In the three years prior to the pandemic, there were about 1.1 to 1.2 million housing units under construction – so the current level is still historically a little high.
Sales
The NAR reported sales were at a “seasonally adjusted annual rate of 4.35 million in December”.
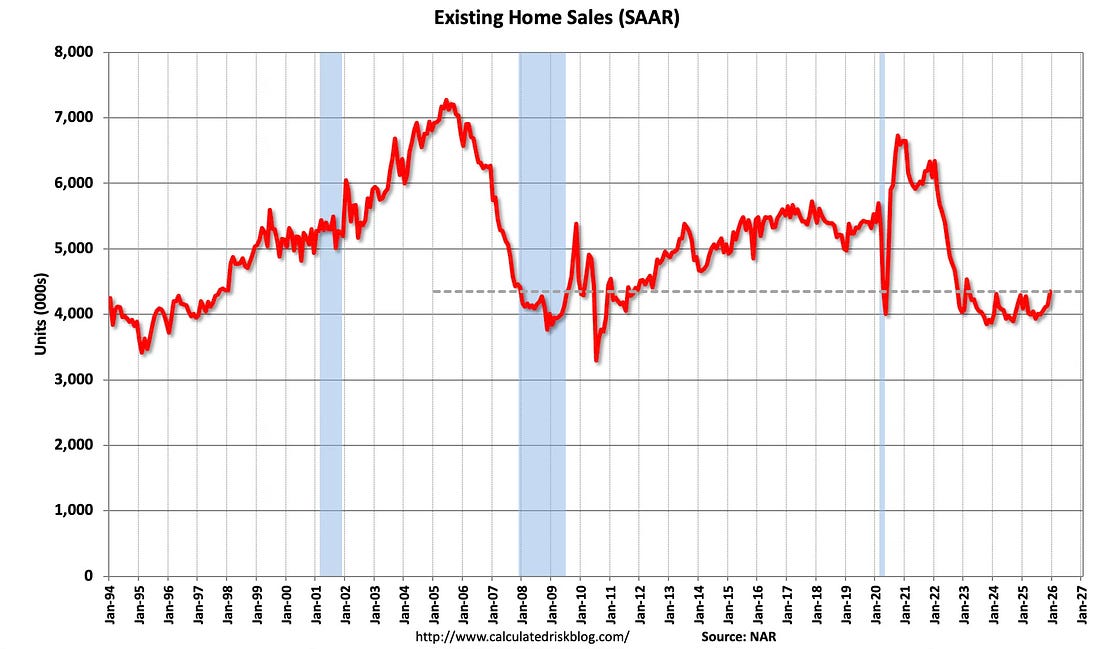
Sales in December were up 5.1% from the previous month and were up 1.4% compared to the December 2024 sales rate. Sales have been very low for the last 3 years.
Annually, sales in 2025 (4.061 million) were slightly below sales in 2024 (4.062 million), and the lowest level of sales since 1995.
And for new home sales, the Census Bureau reported “Sales of new single-family houses in October 2025 were at a seasonally-adjusted annual rate of 737,000”, up 18.7% YoY from October 2024.
New home sales have bounced around mostly between 600 and 750 thousand for the last three years. This is well above the housing bust years.
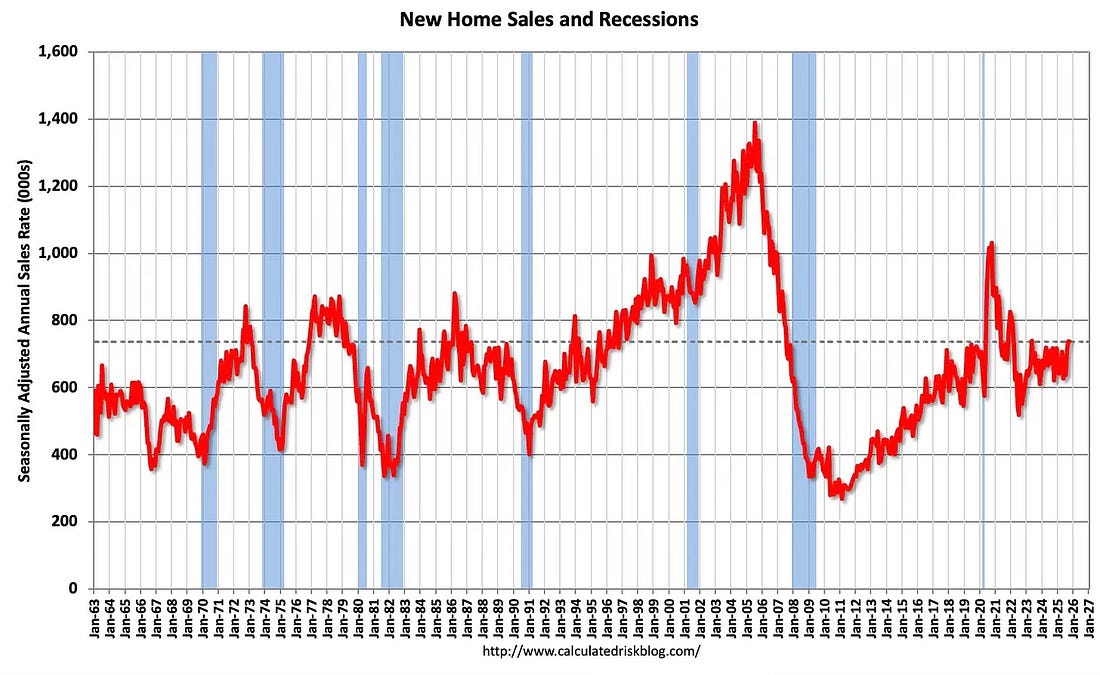
New home sales are near pre-pandemic levels. New home sales have held up much better than existing home sales as homebuilders build less expensive homes and offer more attractive financing for potential buyers (as opposed to existing homes).
In Part 2, I’ll review house prices, rents, mortgage rates, and more.