CALCULATEDRISK
By Bill McBride
Last Friday, in Part 1: Current State of the Housing Market; Overview for mid-January 2026 I reviewed home inventory and sales. I noted that the key stories this year for existing homes are that inventory increased sharply (almost back to pre-pandemic levels), and sales in 2025 were the lowest since 1995 (slightly lower than in 2024). That means prices are under pressure, although there will not be a huge wave of distressed sales since most homeowners have substantial equity and low mortgage rates.
In Part 2, I will look at house prices, mortgage rates, rents and more.
The house price trend suggests house prices will be mostly unchanged year-over-year by the end of 2025. Lower mortgage rates have led to a pickup in purchase mortgage applications recently, but this hasn’t led to significantly more sales, at least not yet.
House Prices
The Case-Shiller National Index increased 1.4% year-over-year (YoY) in October and will likely be about the same or slightly lower year-over-year in the November report compared to October (based on other data).
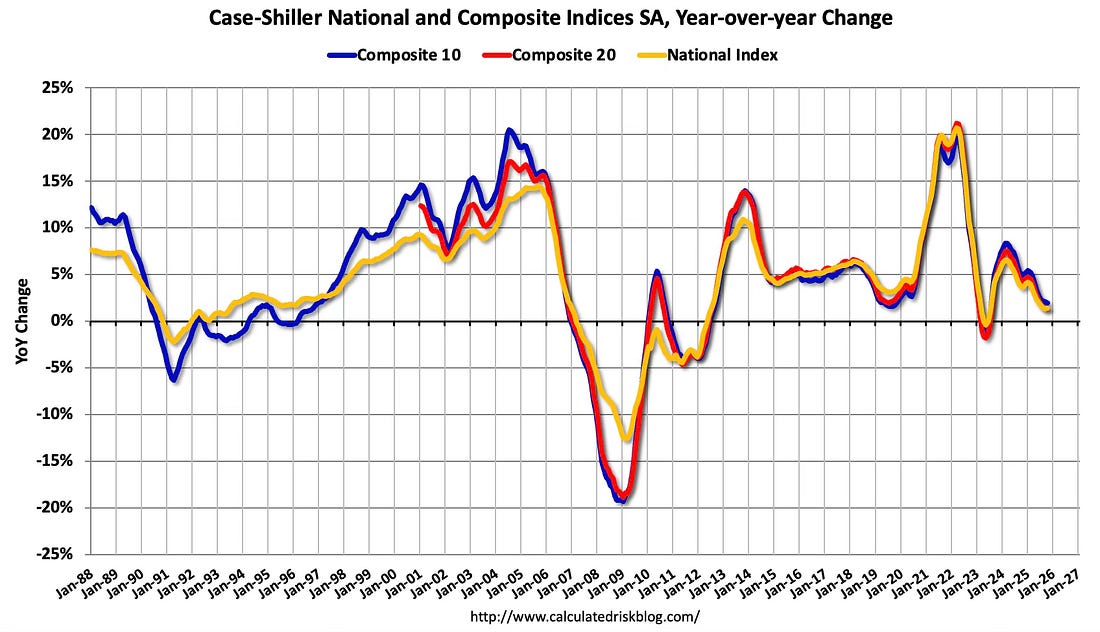
The Composite 10 NSA was up 1.9% year-over-year. The Composite 20 NSA was up 1.3% year-over-year. The National index NSA was up 1.4% year-over-year.
The National index increased 0.37% month-over-month (MoM). This is the 3rd consecutive month with a MoM increase seasonally adjusted that followed 5 consecutive months with a MoM decline.
The October Case-Shiller index was a 3-month average of closing prices in August, September and October. August closing prices include some contracts signed in June. So, not only is the year-over-year change trending down, but there is a significant lag to this data.
Let’s review some more timely house price data …
Other measures of house prices suggest prices will be about the same or slightly lower year-over-year in the November Case-Shiller index as in the October report. The NAR reported median prices were up 0.4% YoY in December, down from 1.4% YoY in November. (Note that median prices are impacted by the mix).
ICE reported prices were up 0.8% YoY in November. Freddie Mac reported house prices were up 1.0% YoY in November, down from 1.1% YoY in October.
Here is a comparison of year-over-year change in the FMHPI, median house prices from the NAR, and the Case-Shiller National index.
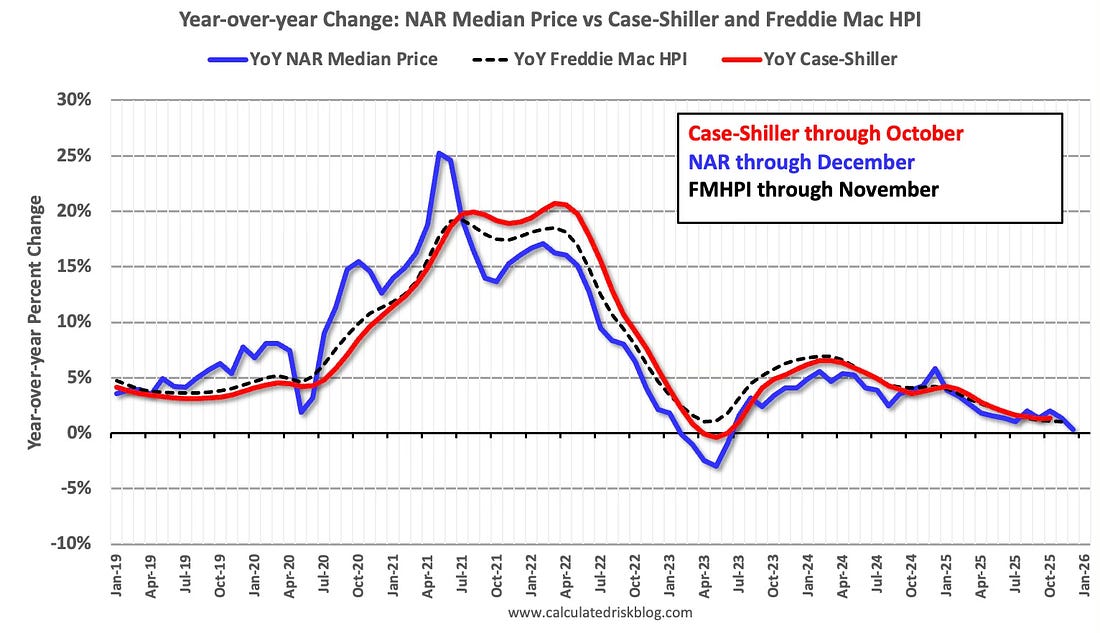
This suggests the Case-Shiller index will likely be up about the same or slightly lower year-over-year in the November report compared to October.
In real terms, the Case-Shiller National index is down 2.7% from the peak in 2022, seasonally adjusted. It has now been 41 months since the real peak in house prices. Typically, after a sharp increase in prices, it takes a number of years for real prices to reach new highs.
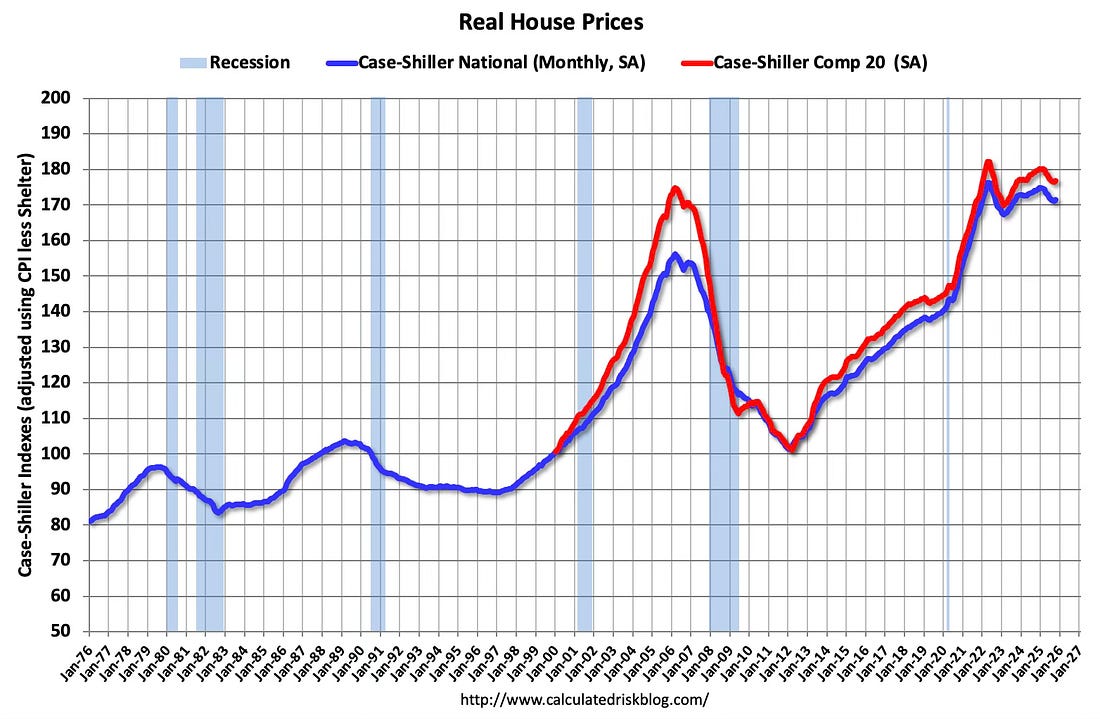
Both the real National index and the Comp-20 index increased in October. This was the first increase in the real National index has in 10 months.
30-Year Mortgage Rates Near 3-Year Low
The following graph from MortgageNewsDaily.com shows mortgage rates since 1999. 30-year mortgage rates were at 6.21% on January 20th. This is up from the recent lows, but near the low end of the range for the last 3 years.
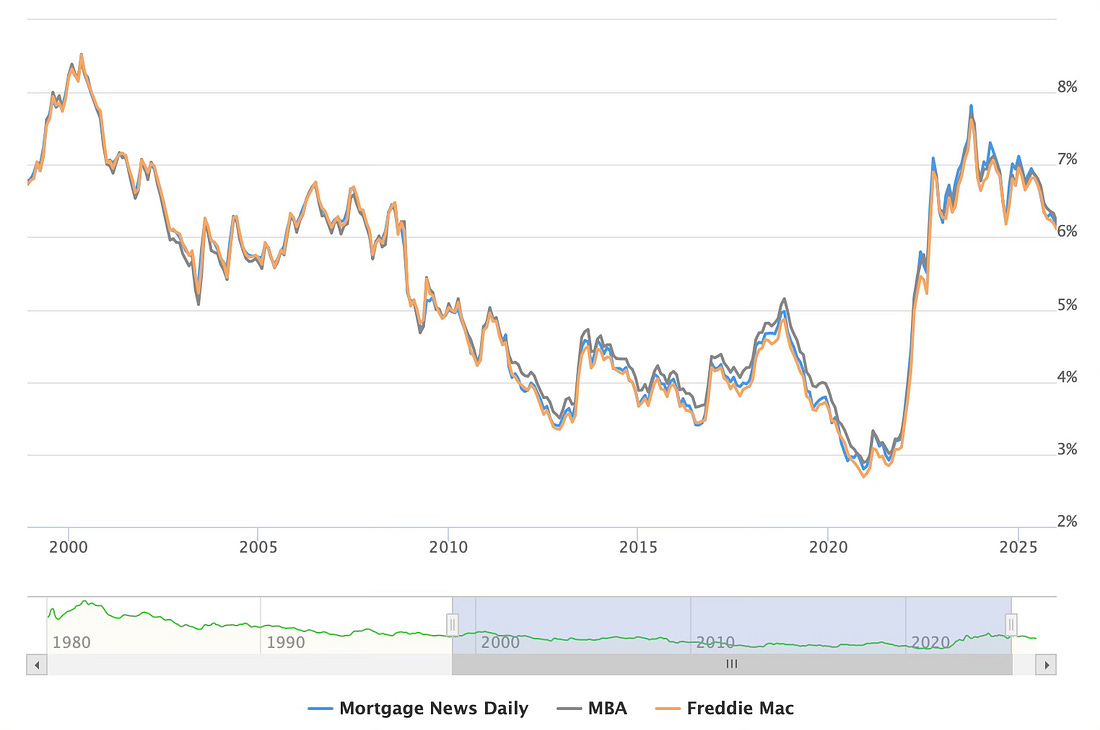
Mortgage rates were low following the financial crisis through the early years of the pandemic. Now rates have returned to a new normal in 30-year mortgage rates in the 6% to 7% range.
A year ago, 30-year mortgage rates were at 7.08%, two years ago rates were at 6.92%, three years ago rates at 6.15%, four years ago at 3.69%, and five years ago at 2.85%.
It is financially very difficult for homeowners that bought or refinanced in 2020 and 2021 to move and give up their 3% mortgage rates, however time and life changes are slowly leading to more listings.
Mortgage Purchase Applications Have Increased
From the MBA this morning:
“Mortgage rates declined further last week, driving another big week for refinance applications, which saw the strongest level of activity since September 2025. The 30-year fixed rate averaged 6.16 percent, the lowest rate since September 2024,” said Joel Kan, MBA’s Vice President and Deputy Chief Economist. “These lower rates prompted greater refinance activity from conventional and VA refinance borrowers, with increases of 29 percent and 26 percent, respectively. Refinance applications accounted for more than 60 percent of applications, and the average loan size also moved higher.”
Added Kan, “Purchase applications were also up over the week, fueled by an 8 percent increase in conventional loan activity, and were almost 18 percent higher than last year.”
Here is a graph showing the MBA mortgage purchase index released this morning. Purchase application activity is up from the lows in late October 2023 and is above the lowest levels during the housing bust.
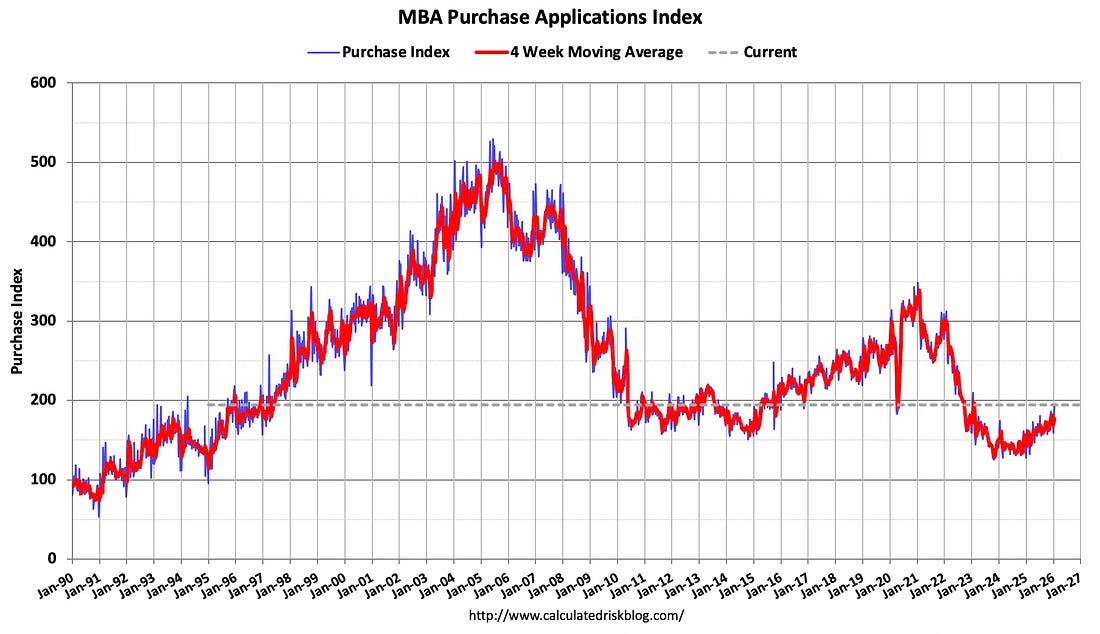
This is still low, but increasing, and suggests some pickup in sales (although this is a slow time for home sales).
And the next graph shows the refinance index since 1990. Refinance activity is still very low but picking up a little with lower mortgage rates.
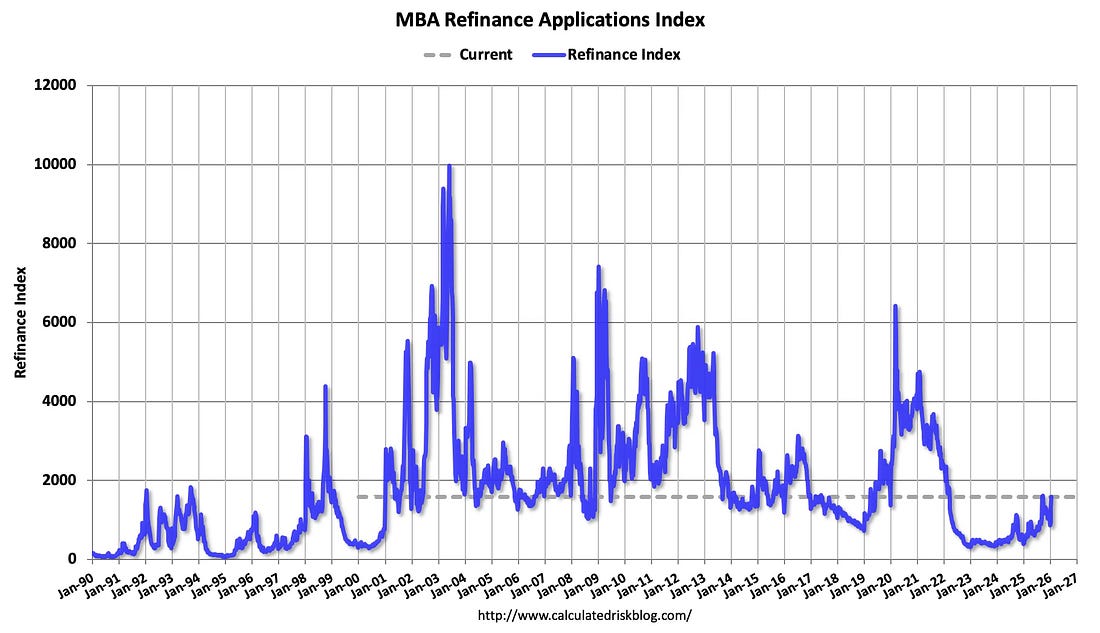
Many of the homebuyers in the last few years have been able to refinance recently.
Asking Rents Declined Year-over-year for Multi-family
Here is a graph of the year-over-year (YoY) change for these measures since January 2015. The government measures and Zillow are through November, and Apartment List is through December 2025.
NOTE: The values for October are missing due the government shutdown, and I used the average of September and November values for the month of October.
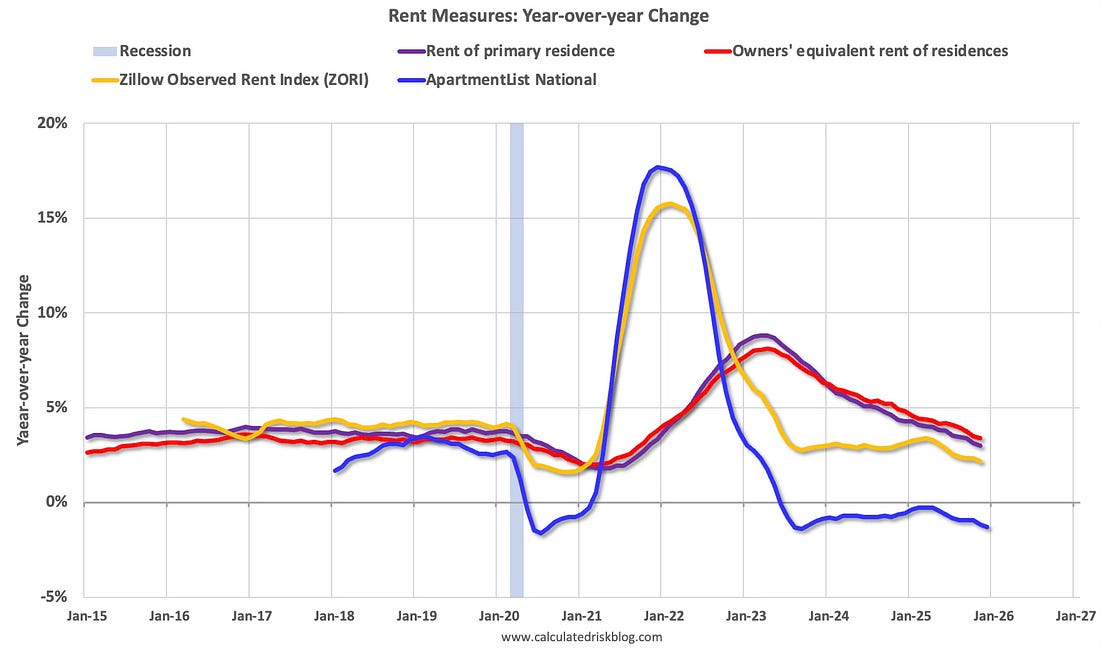
The Zillow measure (single and multi-family) is up 2.2% YoY in November, down from 2.3% YoY in October, and down from a peak of 15.8 YoY in February 2022.
The ApartmentList measure is -1.3% YoY as of December, down from -1.1% in November, and down from a peak of 17.7% YoY December 2021.
Asking rents declined YoY for multi-family and with new supply coming on the market (although at a lower level than last year), we will likely see continued pressure on asking rents. It is possible that policy (less immigration, more deportations) could also put downward pressure on rents.
Current Outstanding Mortgage Rates
Here is some data showing the distribution of interest rates on closed-end, fixed-rate 1-4 family mortgages outstanding at the end of each quarter since Q1 2013 through Q3 2025.
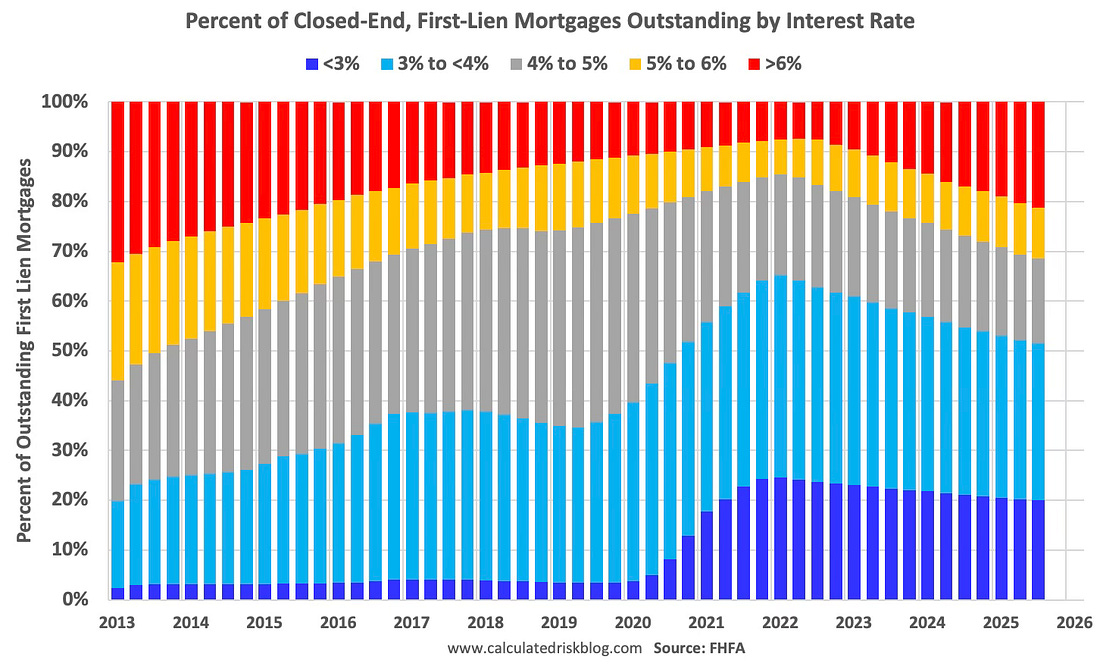
This shows the surge in the percent of loans under 3% starting in early 2020 as mortgage rates declined sharply during the pandemic.
Note that a fairly large percentage of mortgage loans were under 4% prior to the pandemic!
The percent of outstanding loans under 4% peaked in Q1 2022 at 65.1% (now at 51.5%), and the percent under 5% peaked at 85.6% (now at 68.6%). These low existing mortgage rates make it difficult for homeowners to sell their homes and buy a new home since their monthly payments would increase sharply.
This was a key reason existing home inventory levels were so low. However, time is eroding this lock-in effect.
The percent of loans over 6% bottomed in Q2 2022 at 7.3% and has increased to 21.2% in Q3 2025.