CALCULATEDRISK
By Bill McBride
This 2-part overview for mid-March provides a snapshot of the current housing market.
Note that we are still missing some key pieces of data due to the government shutdown. The Census Bureau released January housing starts this week, and is scheduled to release new home sales for January next week. Usually we’d be looking for starts and new home sales for February in the coming week!
The key story for existing homes is that months-of-inventory is mostly above pre-pandemic levels, due to a combination of increasing inventory and sluggish sales. That means prices are under pressure and we might see a year-over-year decline in prices sometime this year. However, there will not be a huge wave of distressed sales since most homeowners have substantial equity and low mortgage rates.
There are also significant regional differences, with some areas seeing more inventory and price declines, and other areas – like the Northeast – seeing smaller increases in inventory and house prices are increasing.
It also appears 2026 will be a difficult year for homebuilders. There are still a large number of completed homes for sales, a larger than normal number of unsold homes under construction and they are reducing prices to compete with more existing home inventory.
Active Listings for Existing Homes Up Year-over-year
Realtor.com reports in the February 2026 Monthly Housing Report: Inventory Rises as Prices Edge Down that new listings were up 2.4% year-over-year in February. And active listings were up 7.9% year-over-year.
The number of actively listed homes rose 7.9% compared to February 2025, marking the 28th consecutive month of year-on-year inventory gains. On a monthly basis, inventory ticked up 0.2% since January (a typical seasonal pattern). Although listings are up again year on year, the pace of that growth has slowed in each of the past nine months (down from 31.9% YoY growth in May). As a result, the national inventory recovery continues to stall out. Specifically, nationwide February inventory is 16.8% below typical 2017–19 levels, about the same as last month.
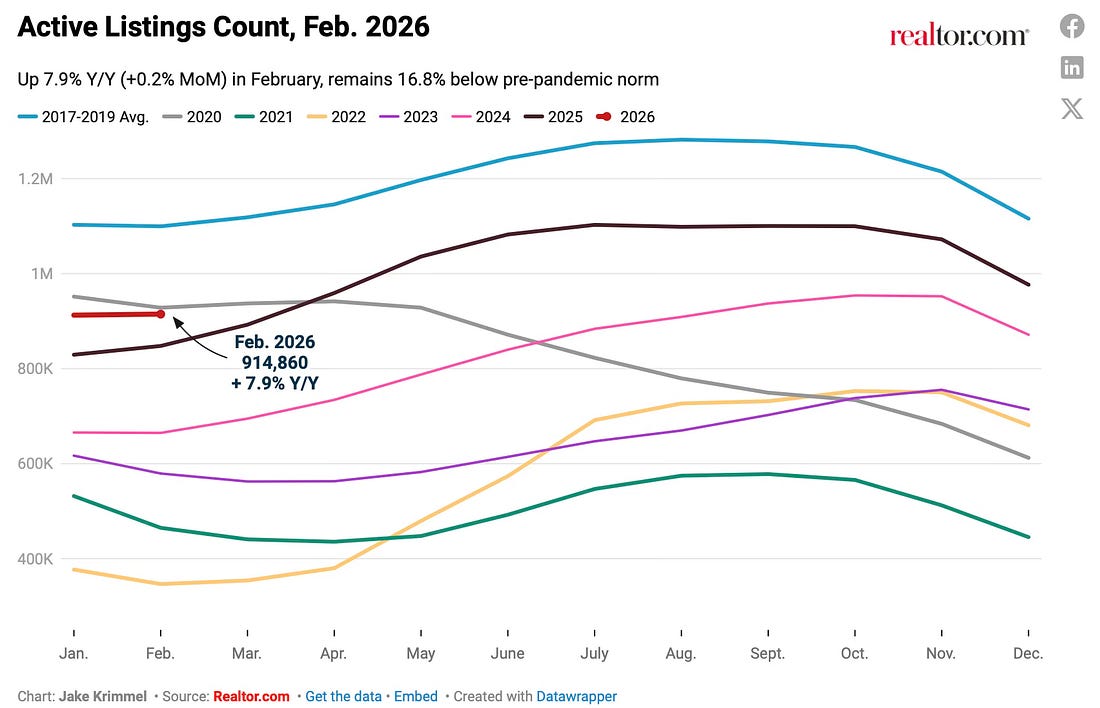
Note the seasonality for active listings. We should expect active listing to pick up over the next few months – but listings are still below pre-pandemic levels (2017 – 2019 on the graph).
Here is some more data on supply and sales.
The following graph shows the seasonal pattern for active single-family inventory since 2015 through March 6, 2026, from Altos Research. The red line is for 2026. The black line is for 2019.
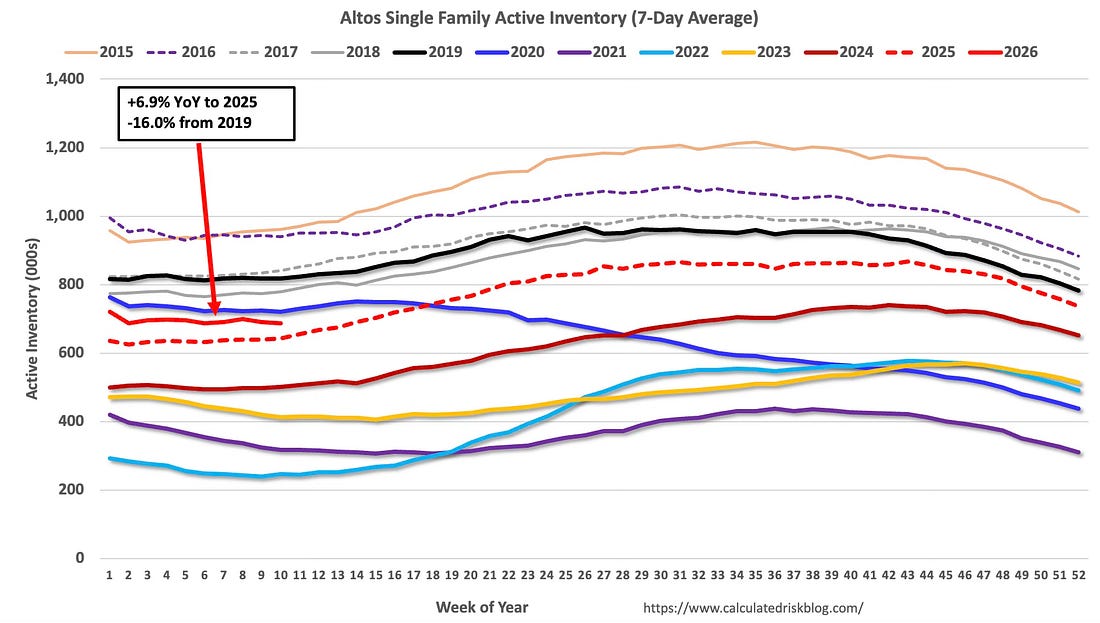
Inventory was up 6.9% compared to the same week in 2025, and down 16.0% compared to the same week in 2019. Inventory is closer to pre pandemic levels, but inventory growth has slowed recently.
Months-of-supply is Mostly Above Pre-pandemic Levels
Since inventory has increased and sales have been mostly flat year-over-year, a key for house prices is to watch months-of-supply. The following graph shows months-of-supply since 2017 using data from the NAR.
Months-of-supply was at 3.8 months in February compared to 3.6 months in February 2019. National months-of-supply is above last year and mostly above pre-pandemic levels (tied with 2017 for February).
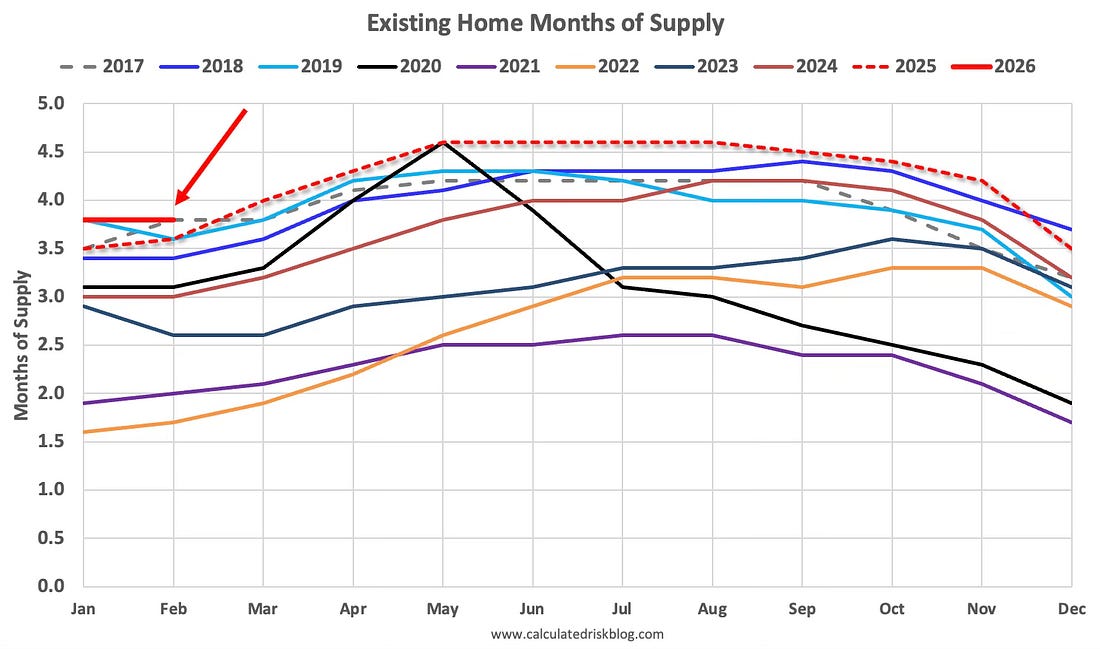
In 2022, we saw some price declines at the National level even with fairly low months-of-supply – probably due to the sharp increase in inventory and some sellers panicking while remembering the housing bust!
Almost 4 Months of Unsold Inventory Under Construction
For new homes, there are over 4 months of homes are under construction (see blue line below), well above the normal levels.
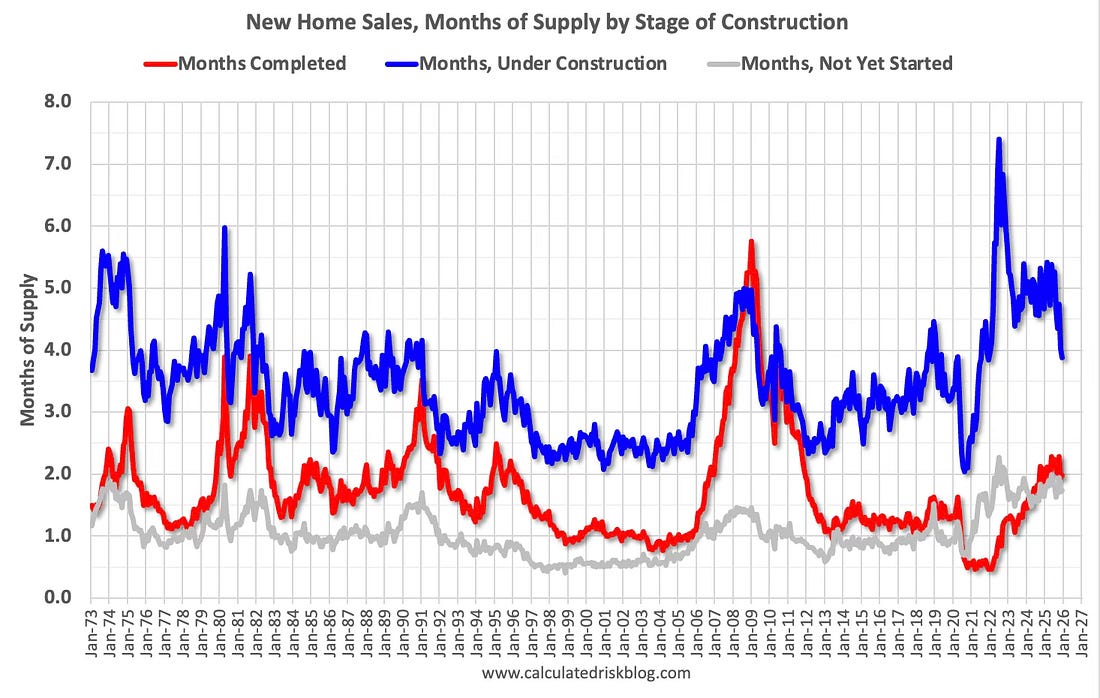
There are 2.0 months of completed supply (red line). This is above the normal level.
The inventory of new homes under construction is at 3.9 months (blue line). This has declined from 7.4 months in July 2022 but is still a larger than normal number of homes under construction.
And 1.7 months of potential inventory that have not been started (grey line) – above the normal level. Homebuilders are probably waiting to start some homes until they clear more inventory, and have a firmer grasp on prices, mortgage rates and demand.
New home inventory, as a percentage of total inventory, is still very high. The following graph uses Not Seasonally Adjusted (NSA) existing home inventory from the National Association of Realtors® (NAR) and new home inventory from the Census Bureau (only completed and under construction inventory).
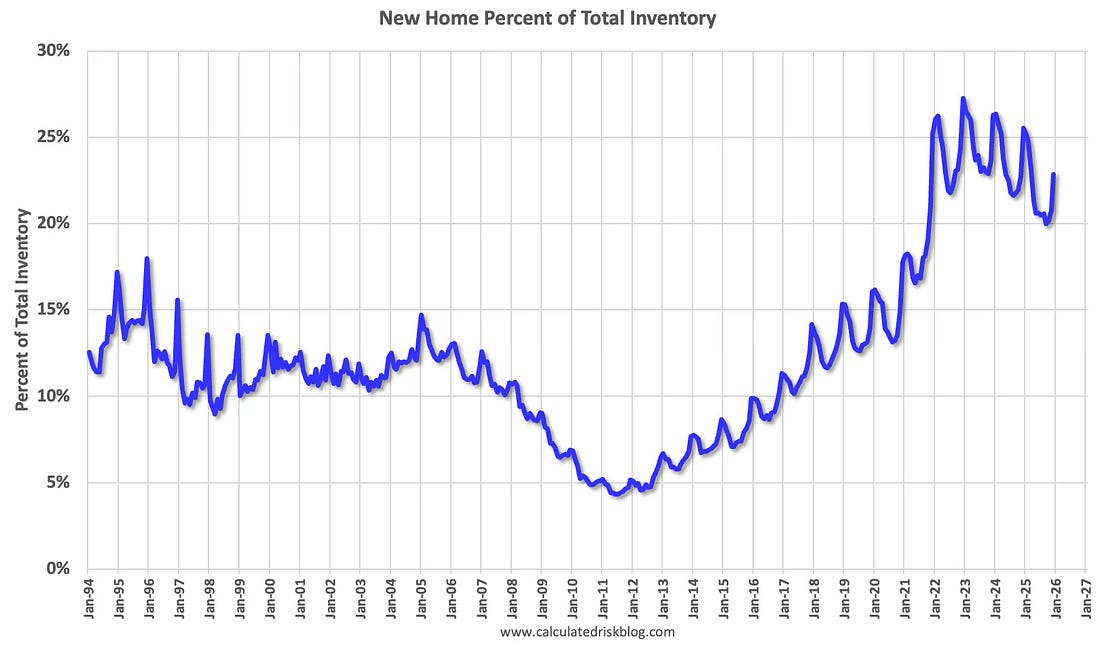
It took a number of years following the housing bust for new home inventory to return to the pre-bubble percent of total inventory. Then, with the pandemic, existing home inventory collapsed and now the percent of new homes is 22.8% of the total for sale inventory, down from 25.5% a year ago in December 2024, and down from a peak of 27.3% in December 2022.
The percent of new homes of total inventory should continue to decline as existing home inventory increases (note seasonal swings since existing home inventory always declines sharply in the Winter, whereas new home inventory is fairly steady).
And for housing starts there are still an above normal number of multi-family housing units under construction, and 1.268 million total units under construction.
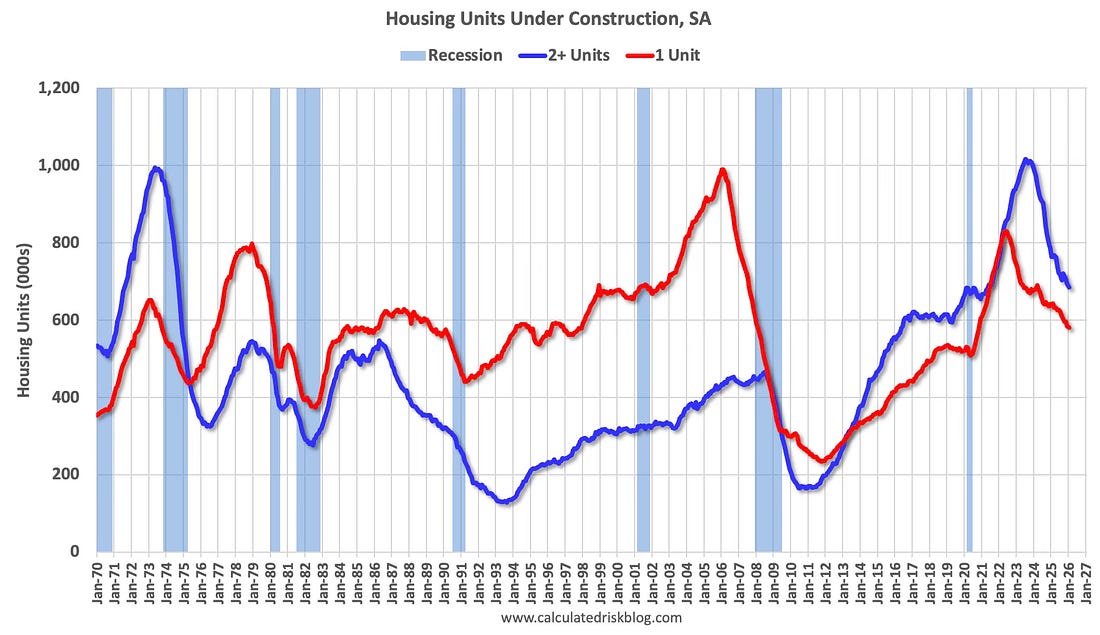
Currently there are 582 thousand single family units (red) under construction (SA). This was down in January compared to December, and 248 thousand below the pandemic peak in June 2022.
Currently there are 686 thousand multi-family units (blue) under construction. This was down from 694 thousand in December. This is 330 thousand below the record set in July 2023 of 1,016 thousand.
Combined, there are 1.268 million units under construction, 447 thousand below the all-time record of 1.715 million set in October 2022.
In the three years prior to the pandemic, there were about 1.1 to 1.2 million housing units under construction – so the current level is still historically a little high.
Sales
The NAR reported sales were at a “seasonally adjusted annual rate of 4.09 million in February”.
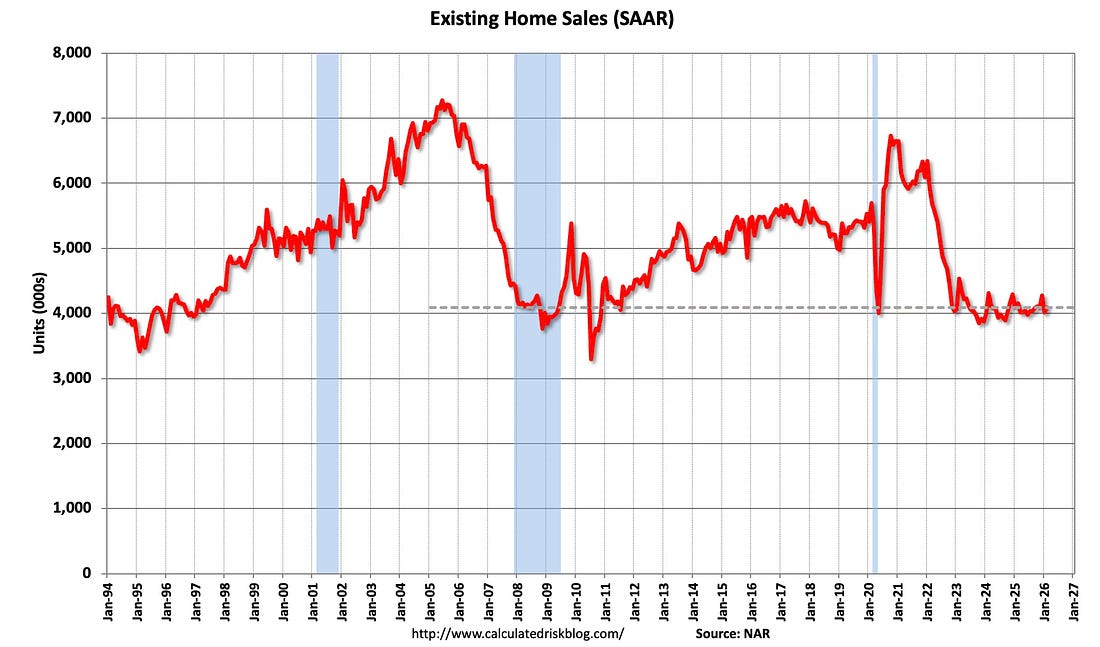
Sales in February (4.09 million SAAR) were up 1.7% from the previous month (January was revised up) and were down 1.4% compared to the February 2025 sales rate. Sales have been very low for 3+ years due to both affordability and The Gaping Hole in the Housing Market.
Year-to-date, NSA, existing home sales in 2026 are down 2.4% compared to the same period in 2025. And sales in 2025 tied 2024 as the lowest level since 1995! 2026 is off to a weak start.
And for new home sales, the Census Bureau reported “Sales of new single-family houses in December 2025 were at a seasonally-adjusted annual rate of 745,000”, up 3.8% YoY from December 2024.
New home sales have bounced around mostly between 600 and 750 thousand for the last three years. This is well above the housing bust years.
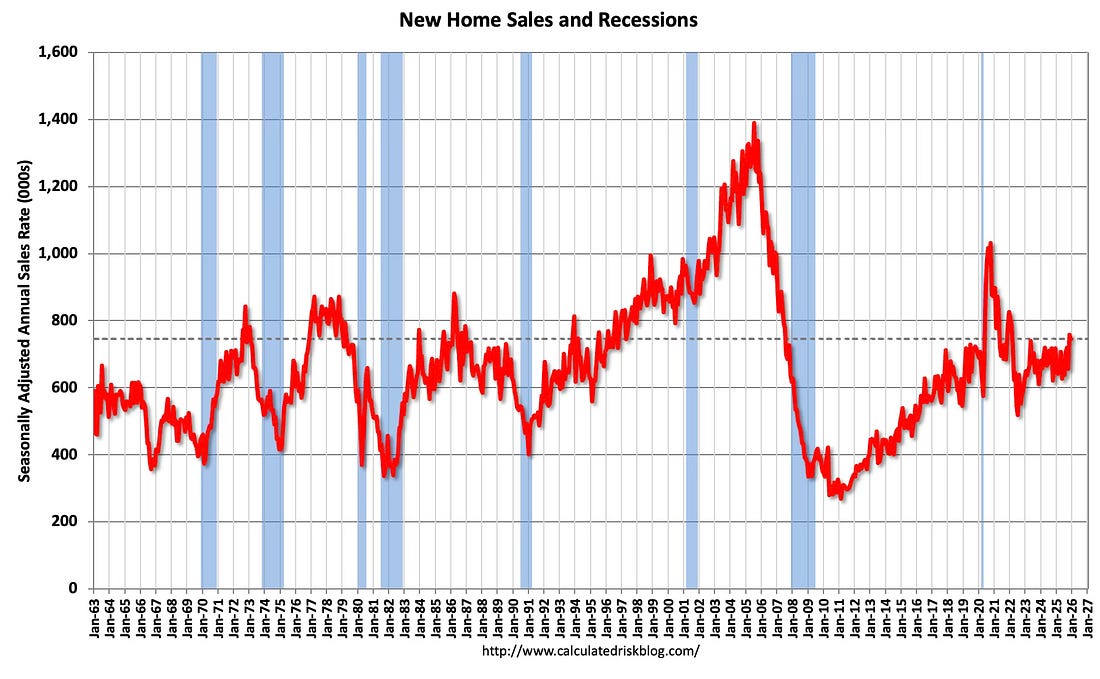
New home sales were above pre-pandemic levels. New home sales have held up much better than existing home sales as homebuilders build less expensive homes and offer more attractive financing for potential buyers (as opposed to existing homes).
In Part 2, I’ll review house prices, rents, mortgage rates, and more.