CALCULATEDRISK
By Bill McBride
In Part 1: Current State of the Housing Market; Overview for mid-April 2026 I reviewed home inventory and sales. I noted that the key stories this year for the existing home market are that months-of-supply was above pre-pandemic levels. And sales to date in 2026 are mostly unchanged from 2025 levels (lowest since 1995)!
That means prices are under pressure, especially in areas with high levels of inventory, although we will NOT see cascading price declines like during the housing bust, since there will not be a huge wave of distressed sales. This is because most homeowners have substantial equity and low mortgage rates.
In Part 2, I will look at house prices, mortgage rates, rents and more.
Lower mortgage rates led to a pickup in purchase mortgage applications in 2025 and early 2026, but that didn’t lead to an increase in sales. More recently, mortgage rates have increased due to the war and purchase applications are down year-over-year (YoY).
House Prices
The Case-Shiller National Index increased 0.9% YoY in January and will likely be about the same in the February report (based on other data).
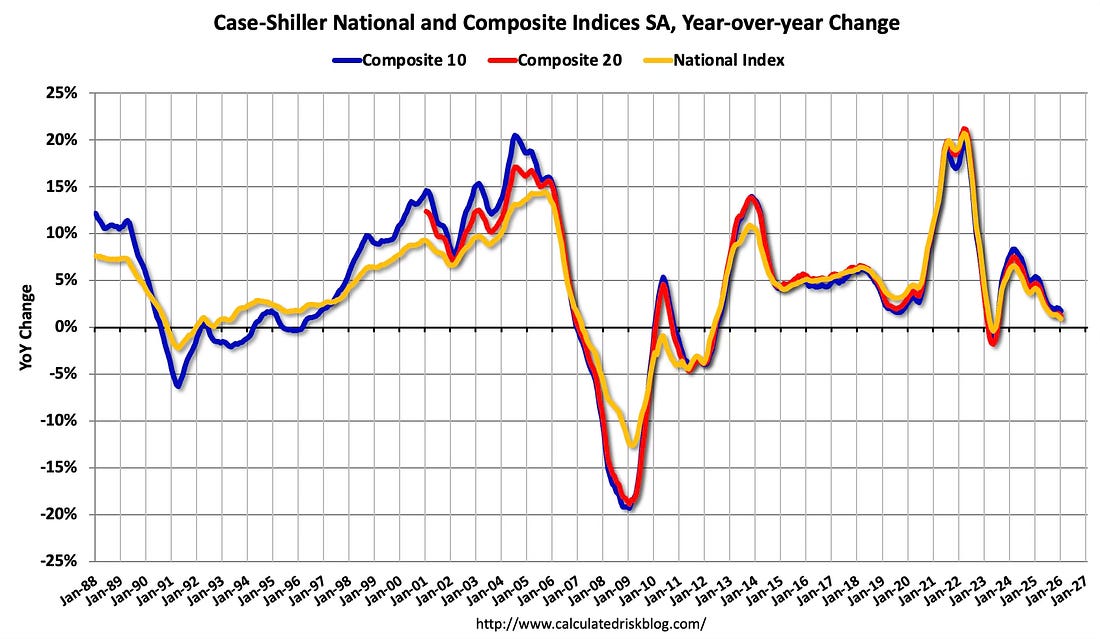
The Composite 10 NSA was up 1.7% YoY. The Composite 20 NSA was up 1.2% YoY. The National index NSA was up 0.9% YoY.
The National index increased 0.23% month-over-month (MoM) seasonally adjusted, This is the 6th consecutive month with a MoM increase seasonally adjusted that followed 5 consecutive months with a MoM decline.
The January Case-Shiller index was a 3-month average of closing prices in November, December and January. November closing prices include some contracts signed in September. So, not only is the year-over-year change trending down, but there is a significant lag to this data.
Let’s review some more timely house price data …
Other measures of house prices suggest prices will be about the same YoY in the February Case-Shiller index as in the January report. The NAR reported median prices were up 1.4% YoY in March, up from 0.3% YoY in February. (Note that median prices are impacted by the mix).
ICE reported prices were up 0.4% YoY in March. Freddie Mac reported house prices were up 0.4% YoY in February, down from up 0.7% YoY in January.
Here is a comparison of year-over-year change in the FMHPI, median house prices from the NAR, and the Case-Shiller National index.
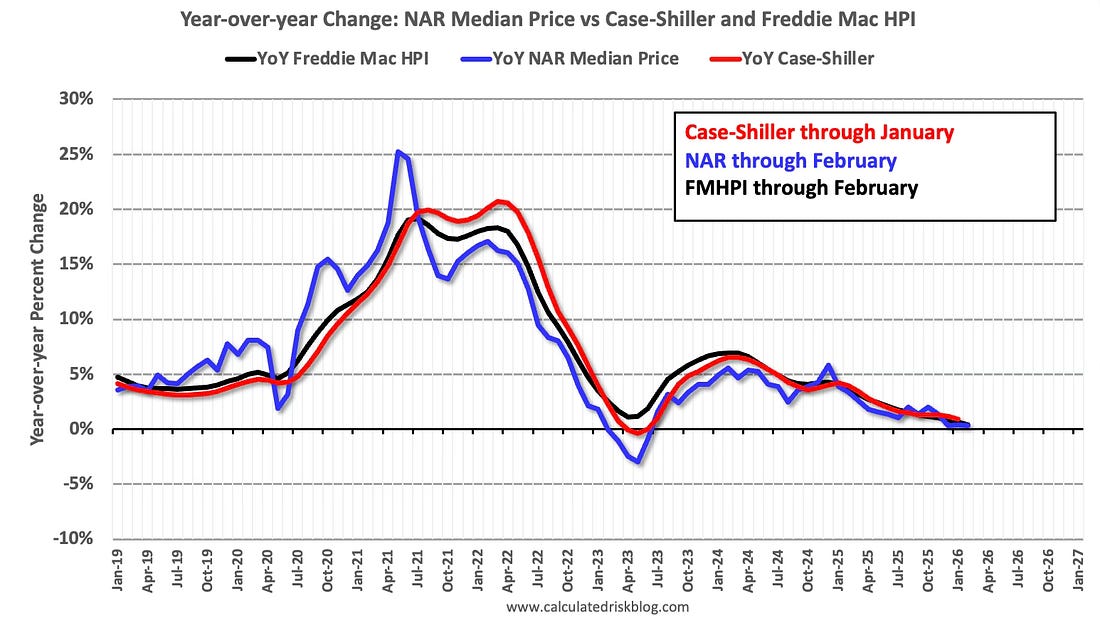
This suggests the Case-Shiller index will likely be up about the same YoY in the February report compared to January.
In real terms, the Case-Shiller National index is down 2.3% from the peak in 2022, seasonally adjusted. It has now been 44 months since the real peak in house prices. Typically, after a sharp increase in prices, it takes a number of years for real prices to reach new highs.
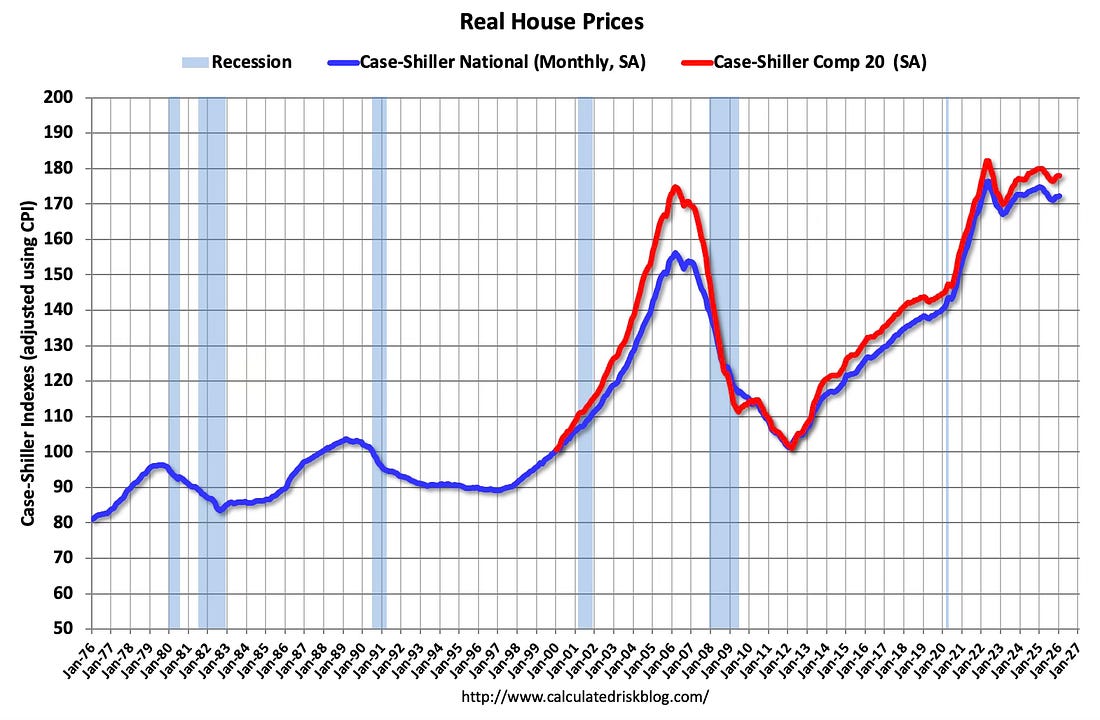
The real National index declined slightly and the Comp-20 index increased slightly in January.
30-Year Mortgage Rates Increased Recently
The following graph from MortgageNewsDaily.com shows mortgage rates since the year 2000. 30-year mortgage rates were at 6.31% on April 14th. Rates have moved up a little recently due to the war.
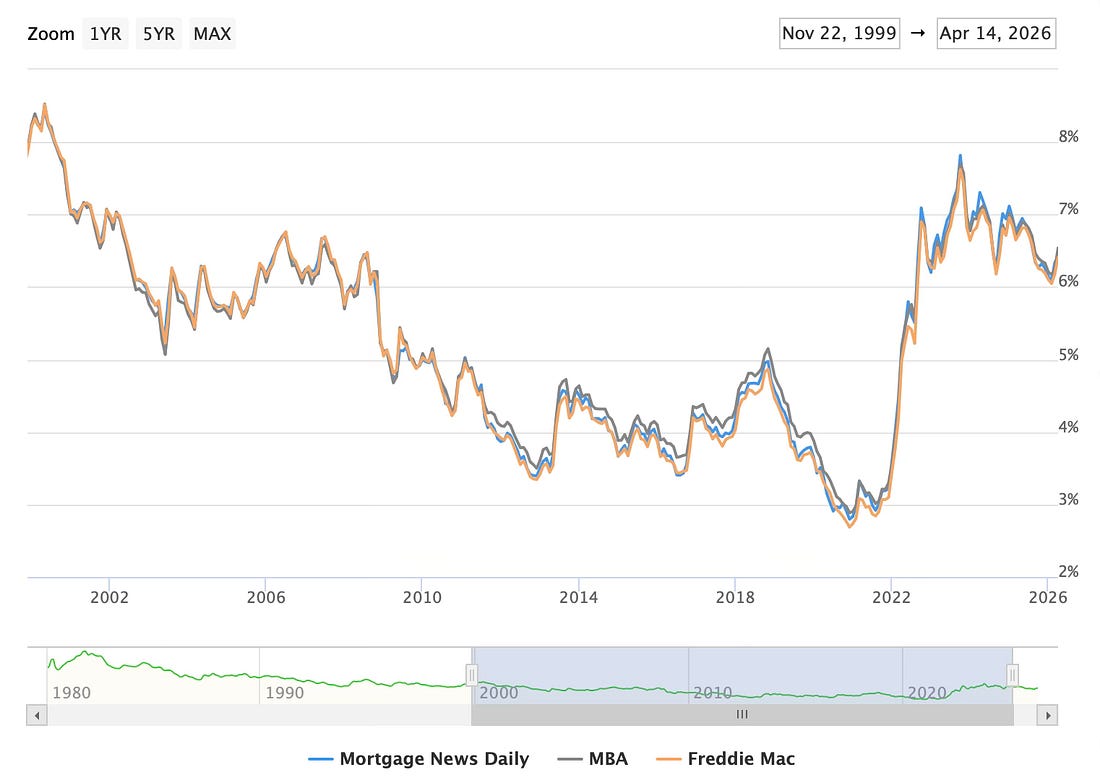
Mortgage rates were low following the financial crisis through the early years of the pandemic. Now rates have returned to a new normal in 30-year mortgage rates in the 6% to 7% range. It is possible that 30-year fixed mortgage rates will move into the high 5% range, but it is unlikely – barring a recession or a crisis – that rates will fall much further.
It is financially very difficult for homeowners that bought or refinanced in 2020 and 2021 to move and give up their 3% mortgage rates. This is a key reason for The Gaping Hole in the Housing Market. However time and life changes are slowly leading to more listings and will likely lead to more sales activity.
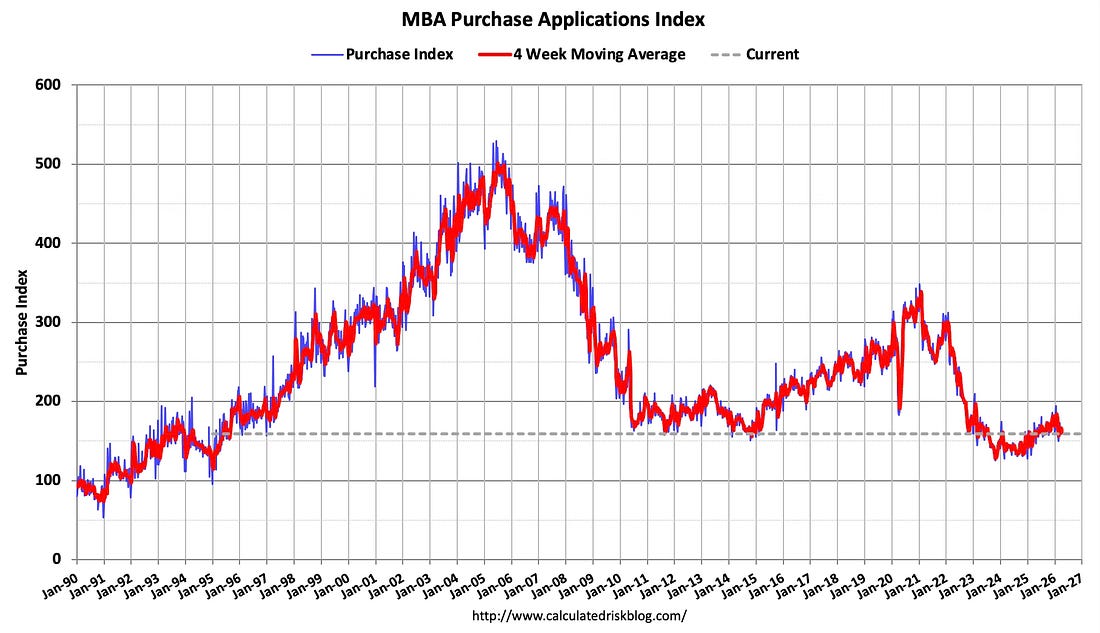
Mortgage Purchase Applications Have Decreased Year-over-year
From the MBA this morning:
The seasonally adjusted Purchase Index decreased 1 percent from one week earlier. The unadjusted Purchase Index was unchanged compared with the previous week and was 3 percent lower than the same week one year ago.
Here is a graph showing the MBA mortgage purchase index. Purchase application activity is up from the lows in late October 2023 but near the lowest levels during the housing bust.
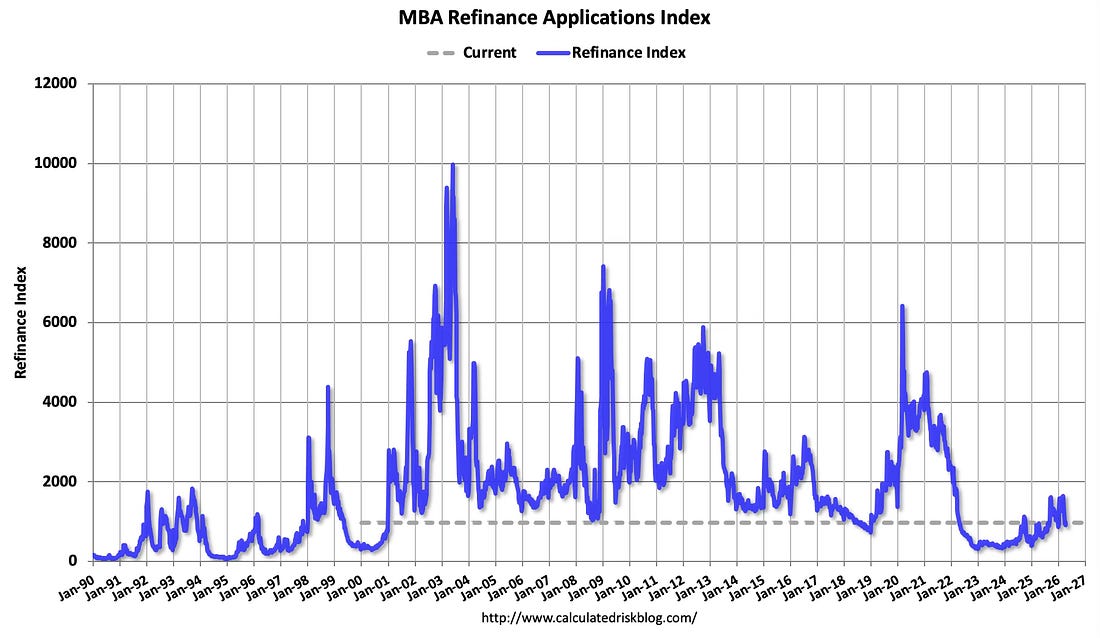
And the next graph shows the refinance index since 1990. Refinance activity is still very low and decreased recently with slightly higher mortgage rates.
Asking Rents Declined Year-over-year for Multi-family
Here is a graph of the year-over-year (YoY) change for several measures since January 2015.
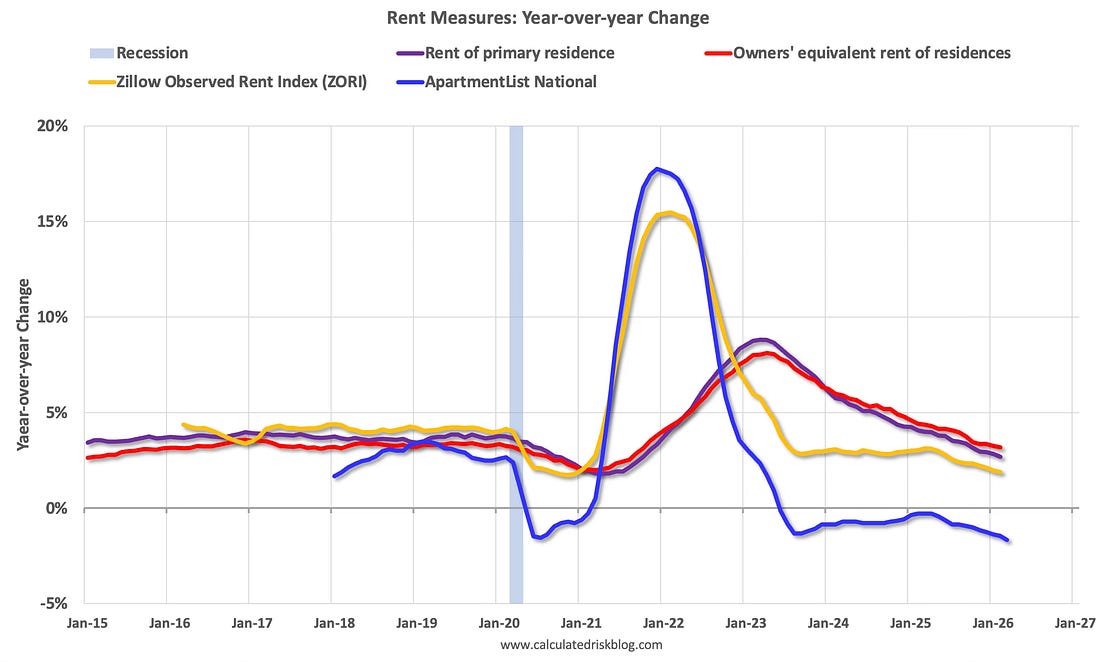
The Zillow measure (single and multi-family) is up 1.9% YoY in February, down from 2.0% YoY in January, and down from a peak of 15.7% YoY in February 2022.
The ApartmentList measure is -1.7% YoY as of March, down from -1.5% in February, and down from a peak of 17.7% YoY December 2021.
The Rent of primary residence was up 2.7% YoY in February, down from 2.8% YoY in January. The Owners’ Equivalent Rent (OER) was up 3.2% YoY in February, down from 3.3% YoY in January.
Asking rents declined YoY and with new supply coming on the market (although at a lower level than last year), we will likely see continued pressure on asking rents. It is possible that policy (less immigration, more deportations) could also put downward pressure on rents.
Current Outstanding Mortgage Rates
Here is some data showing the distribution of interest rates on closed-end, fixed-rate 1-4 family mortgages outstanding at the end of each quarter since Q1 2013 through Q4 2025.
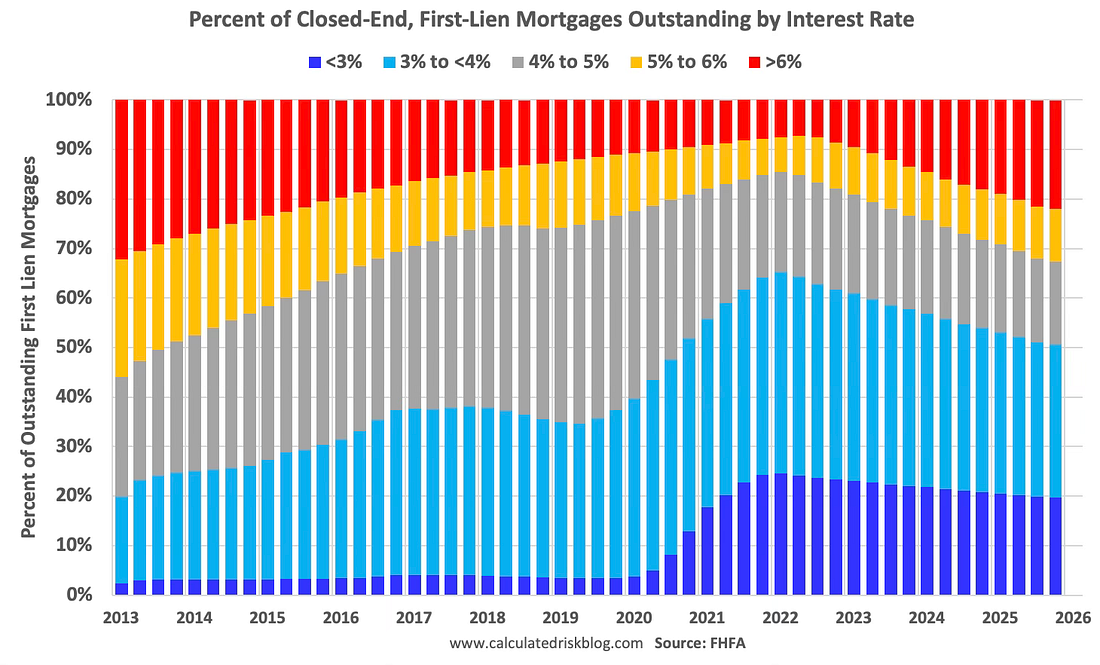
This shows the surge in the percent of loans under 3% starting in early 2020 as mortgage rates declined sharply during the pandemic.
Note that a fairly large percentage of mortgage loans were under 4% prior to the pandemic!
The percent of outstanding loans under 4% peaked in Q1 2022 at 65.1% (now at 50.6%), and the percent under 5% peaked at 85.6% (now at 67.4%). These low existing mortgage rates make it difficult for homeowners to sell their homes and buy a new home since their monthly payments would increase sharply.
This was a key reason existing home inventory levels were so low. However, time is eroding this lock-in effect.
The percent of loans over 6% bottomed in Q2 2022 at 7.3% and has increased to 21.9% in Q4 2025.