CALCULATEDRISK
By Bill McBride
Almost a year ago I wrote: House Price Battle Royale: Low Inventory vs Affordability. Here is an update as the battle continues!
I’ve been wrestling with the impact on house prices of the rapid increase in mortgage rates and monthly payments over the last two years. My reaction was the current situation was somewhat similar to the 1978 to 1982 period and we would likely see prices decline in real terms (adjusted for inflation). See from March 2022: Housing: Don’t Compare the Current Housing Boom to the Bubble and Bust.
In that article I wrote on prices:
[W]e should expect something similar to the what happened in the late ‘70s – a decline in real house prices seems likely … Currently we just have to watch and wait. However, we can be fairly confident that we won’t see cascading nominal price declines like during the housing bust – since there will be few distressed sales.
In the 1980 period, nominal prices only declined slightly on a month-to-month basis a few times according to the Case-Shiller National house price index. However, real prices – adjusted for inflation – declined 10.7% from the peak. The inflation adjusted peak was in October 1979, and real prices didn’t exceed that peak until May 1986 (See from October 2022: House Prices: 7 Years in Purgatory).
Note that if we use the Freddie Mac House Price Index, nominal prices declined 6.9% in the early 1980s, and real prices declined 17.5%!
As I noted in “7 Years in Purgatory”:
Earlier this year, I argued the most likely path for house prices was for nominal prices to “stall”, and for real prices (inflation adjusted) to decline over several years. The arguments for a stall included historically low inventory levels, mostly solid lending over the last decade, and that house prices tend to be sticky downwards.
And the historically low level of inventory is a key reason nominal house prices haven’t declined. As of January 2024, the Case-Shiller National Index was at a new peak in nominal terms (seasonally adjusted), and off 2.4% from the previous peak in real terms.
For the Case-Shiller National Index, real house prices peaked in May 2022 – almost two years ago.
Here is a look at the house price battle between low inventory and affordability.
The following graph is based on data from Altos Research showing active single family home inventory over the last 10 years through April 5th. Inventory collapsed in 2020 due to a combination of factors: supply was restricted since many homeowners didn’t want strangers in their homes, and demand picked up significantly as mortgage rates fell sharply at the beginning of the pandemic. Also, investor buying increased significantly, and demographics were favorable for homebuying.
Inventory fell further in 2021 and then picked up sharply in the 2nd half of 2022 as mortgage rates increased. With record low levels of inventory in late 2020, 2021 and early 2022, house prices soared with the Case-Shiller index up over 19% in 2021 alone.
Currently inventory is above the levels in 2021, 2022 and 2023, and it seems likely that inventory will be above 2020 levels mid-year, since inventory is increasing this year, and was declining sharply in 2020. However, inventory is still well below normal levels.
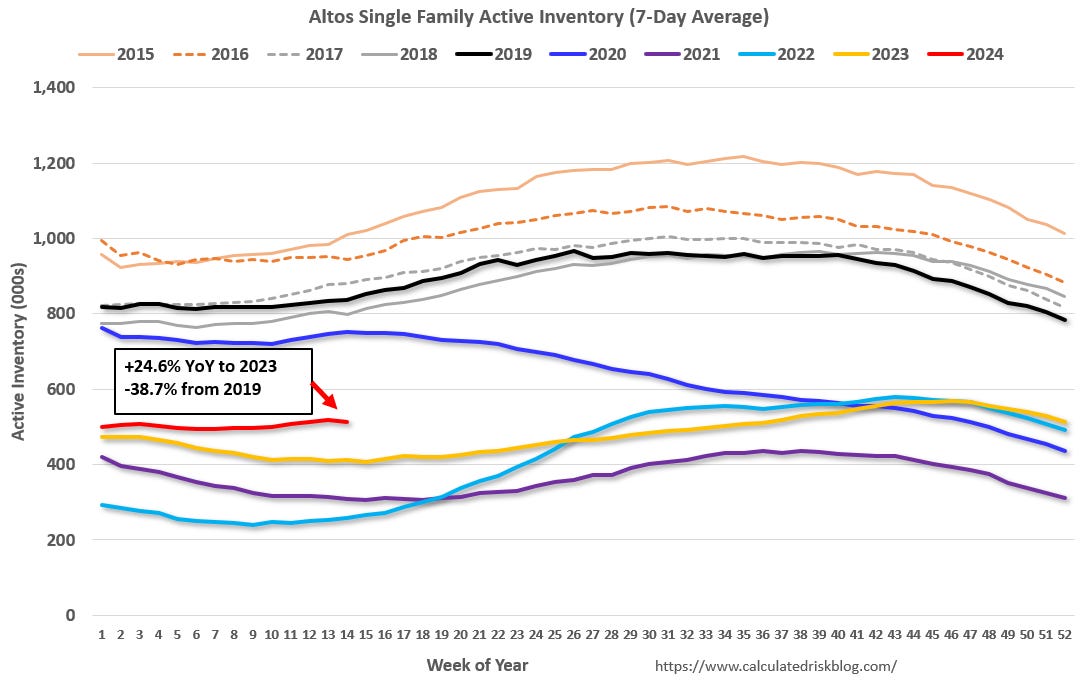
Note the inventory surge in mid-2022 as mortgage rates increased. That led to some price declines, however, the inventory surge in 2022 was somewhat of a head fake! Some potential sellers quickly listed their homes, probably remembering what happened with house prices in the 2006 to 2011 period, but that surge ended pretty quickly.
The next graph that shows existing home months-of-supply, inverted, from the National Association of Realtors® (NAR) vs. the seasonally adjusted month-to-month price change in the Case-Shiller National Index (both since January 1999 through January 2024). Note that the months-of-supply is not seasonally adjusted. The last 20 months are in black showing a shift in the relationship, and prices fell in late 2022 and early 2023 with low levels of inventory.However, the relationship is somewhat back to normal now.
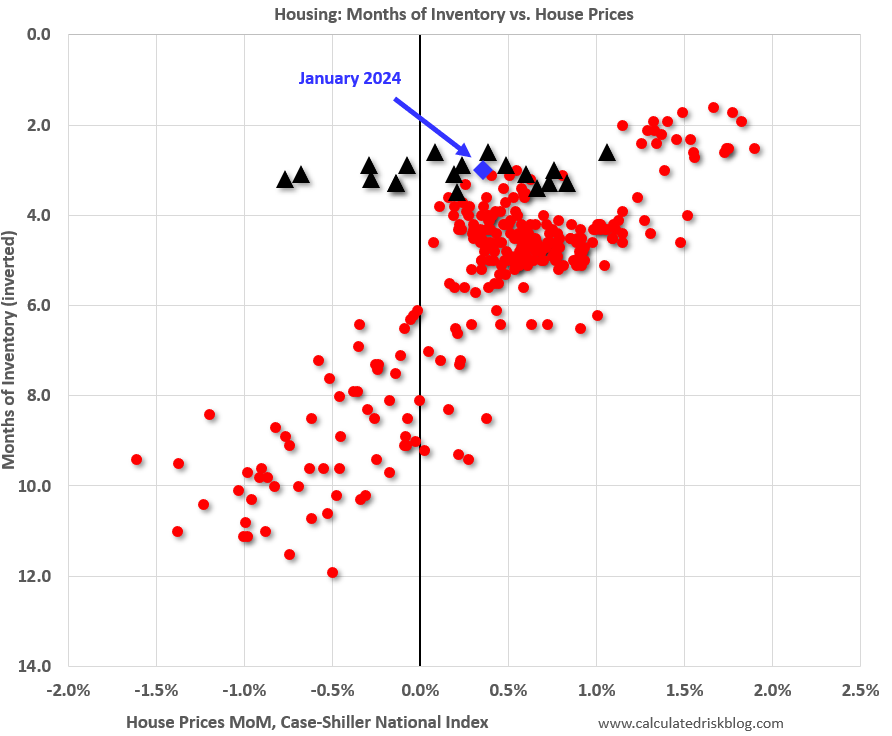
The key reasons that prices fell for several months in 2022 and 2023, with these levels of inventory, was the rapid increase in mortgage rates and monthly payments, and the mid-2022 surge in inventory. Here is a graph of my affordability index (lower is more affordable):
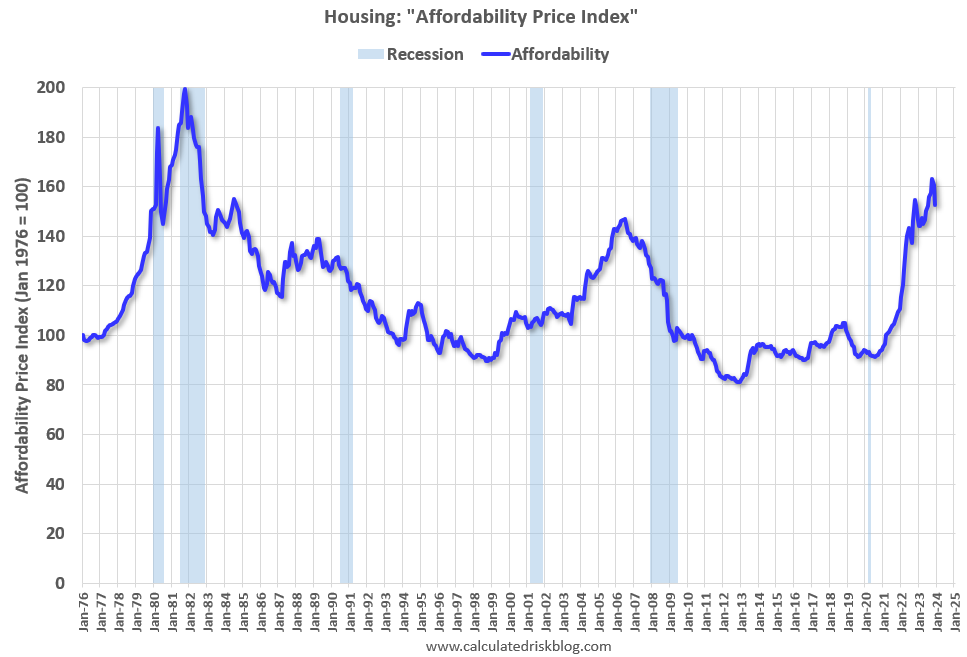
Note that by this index, during the early ‘80s, homes were very unaffordable due to the very high mortgage rates. During the housing bubble, houses were at about the same level of unaffordability using 30-year mortgage rates, however, during the bubble, there were many “affordability products” that allowed borrowers to be qualified at the teaser rate (usually around 1%) that made houses seem more affordable.
Watch Months-of-Supply!
Although inventory is well below normal levels, so are sales. I think we need to keep an eye on months-of-supply. Historically nominal prices declined when months-of-supply approached 6 months – and that is unlikely this year – but we could see months-of-supply back to 2019 levels later this year.
What would it take to get months-of-supply back to 2019 levels by mid-year? The following table is a simple exercise. If sales stay depressed at 2023 levels, how much would inventory have to increase to put months-of-supply at 2019 levels?
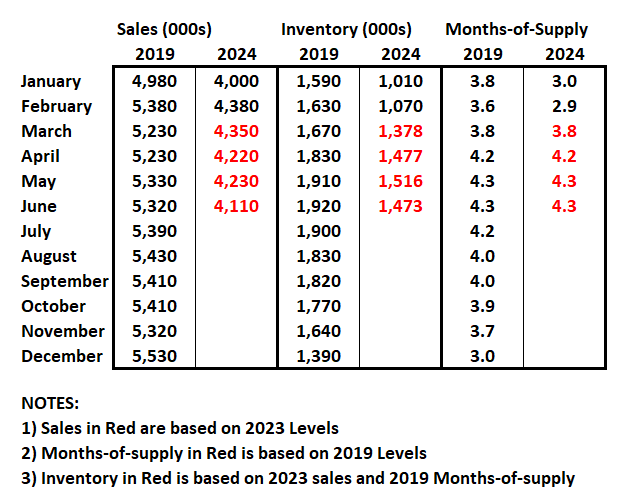
The answer is NAR reported inventory would have to increase to around 1.5 million by mid-year. That would be a 40% increase from the February levels, but still leave inventory about 22% below 2019 levels.
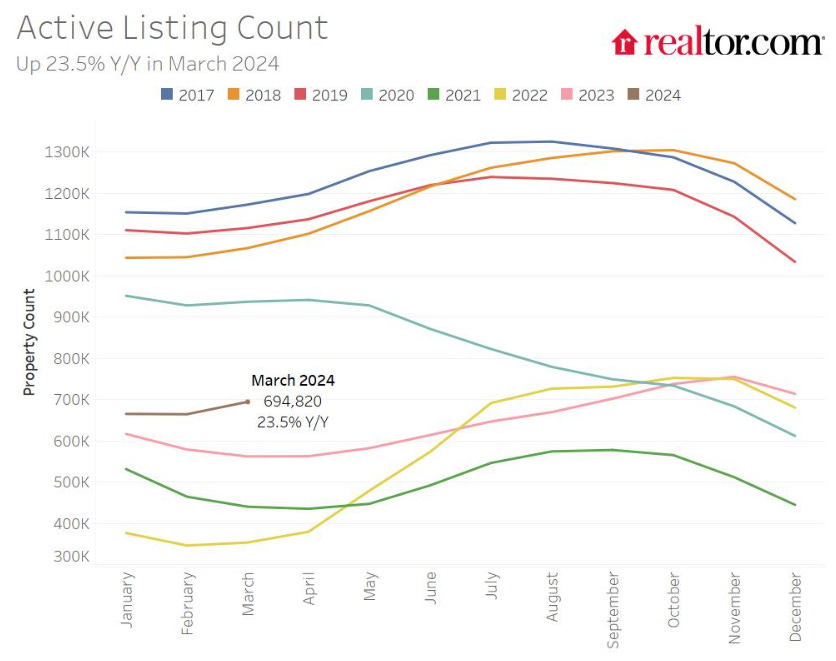
Realtor.com recently reported for March:
There were 23.5% more homes actively for sale on a typical day in March compared with the same time in 2023, marking the fifth consecutive month of annual inventory growth. … However, while inventory this March is much improved compared with the previous three years, it is still down 37.9% compared with typical 2017 to 2019 levels.
Using the Realtor.com data, inventory would have to increase to around 930 thousand for months-of-supply to be back to 2019 levels by mid-year. This is a much larger than normal percentage increase in inventory but would still leave inventory down about 25% compared to 2019. This is possible.
Note that months-of-supply is calculated using the Seasonally Adjusted (SA) sales rate, and the Not Seasonally Adjusted (NSA) levels of inventory. Months-of-supply was actually back to 2019 levels in December (for just one month).
Inventory and months-of-supply will be something to watch carefully in 2024!
For now, the “House Price Battle Royale” between inventory and affordability will continue.