CALCULATEDRISK
By Bill McBride
Press Release: ICE Mortgage Monitor: Mortgage lending quietly hits highest quarterly volume since 2022, driven by purchase and cash-out refinance loans
Intercontinental Exchange, Inc. … August 2025 Mortgage Monitor report. ICE data reveals that mortgage originations had their highest quarterly volume since 2022, with both purchase and cash-out refinance activity nearing three-year highs. At the same time, total and tappable home equity volumes were the highest on record.
“Homeowners are actively drawing on record equity with cash-out refinance loans, signaling increased demand despite elevated rates,” said Andy Walden, Head of Mortgage and Housing Market Research at ICE. “Meanwhile, a substantial cohort of people who purchased homes over the last three years are watching on the sidelines for rates to drop so they can refinance into a lower monthly payment.”
- Cash-out refinances drive the majority of refinance activity
Cash-out refinances accounted for 59% of all refinance transactions in the second quarter. Notably, 70% of those borrowers accepted higher interest rates, averaging a 1.45 percentage point increase, in exchange for tapping an average of $94,000 in home equity. These borrowers saw monthly payments increase by about $590. Cash-out borrowers tended to have lower average credit scores (719) and smaller loan balances ($188,000) compared to their rate-and-term counterparts. See the full report for more detail.
- Home equity hits record high
Tappable equity hit another record high in Q2, with borrowers entering Q3 with a record $17.8 trillion in total equity, including $11.6 trillion in tappable equity that can be accessed while maintaining a 20% cushion. Roughly 48 million mortgage holders had tappable equity, with the average homeowner holding $213,000 in accessible value.
- Slowing home prices may signal plateauing equity growth
While equity levels remain high, the pace of home equity growth has slowed to its lowest rate in two years. This deceleration is largely attributable to declining home prices in key Sunbelt and Western markets. Cities like Austin (-38%) and Deltona, Fla. (-37%) have seen tappable equity per borrower fall by more than 25% from recent peaks. Nearly one-quarter of U.S. markets have experienced at least a 5% drop in tappable equity. Additionally, about 1% of mortgage holders – roughly 564,000 borrowers – now owe more than their homes are worth. emphasis added
Mortgage Delinquencies Increased in June
Here is a graph of the national delinquency rate from ICE. Overall delinquencies decreased in June and are below the pre-pandemic levels. Source: ICE McDash
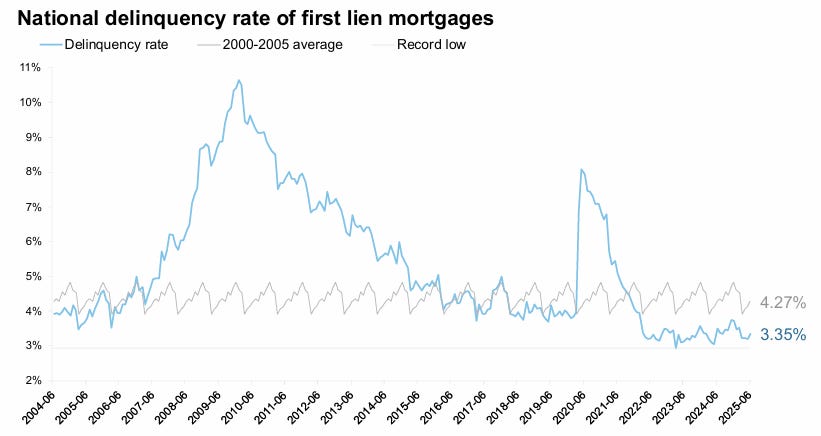
- The national delinquency rate rose by 15 basis points (bps) in June to 3.35% driven by a rise in early-stage delinquencies
- FHA delinquencies, which tend to experience more seasonality, rose by 41 bps in the month, hitting their highest June level since 2013, excluding the 2020-2021 pandemic-era impact
- The share of past-due FHA loans typically rises by around 15% from June through December; if that trend holds in 2025, roughly one in eight FHA loans would be delinquent at the end of the year
- Non-current FHA loans (delinquencies plus foreclosures) increased +25 bps year over year, making FHA loans the only loan product type to show an increase
- The non-current rates on GSE (-8 bps), portfolio (-18 bps) and VA (-24 bps) loans were all down from June 2024, a month that ended on a Sunday, which created a temporary rise in mortgage delinquencies
- The VA decline was aided by a resumption in foreclosures, which pushed some delinquencies through the pipeline
- FHA loans now represent more than half of all seriously past due (90+ day) mortgages nationwide despite accounting for only ~15% of active mortgages
House Price Growth Continues to Slow
Here is the year-over-year in house prices according to the ICE Home Price Index (HPI). The ICE HPI is a repeat sales index. ICE reports the median price change of the repeat sales. The index was up 1.0% year-over-year in July, down from 1.3% YoY in June.

- Mortgage rates in the high 6% range and improvements in for-sale inventory drove further home price cooling in July
- Annual home price growth eased to +1.0% in July, down from +1.3% in June and +3.6% at the start of the year
- That’s the softest growth rate since 2012, outside of the initial market reaction to mortgage rates pushing above 6% in April and May 2023
- Prices dipped by 0.06% in the month on a seasonally adjusted basis, which is equivalent to a seasonally adjusted annualized rate (SAAR) of -0.7% suggesting more slowing may be on the horizon
- Single family prices were up by +1.4% from the same time last year in July, while condo prices are now down -1.8%, marking the softest condo market since early 2012
- More than half of all major markets are seeing condo prices below last year’s levels, with 9 of the 11 softest condo markets located in Florida, led by Cape Coral (-13.4%) and North Port (-11.2%)

Inventory Increasing Sharply, Significant Regional Differences
This graph shows ICE’s estimate of the National inventory deficit (change from 2017 – 2019 levels).

- Inventory continues to be the headline trend for the real estate industry mid-2025, especially with inventory trends beginning to shift in recent months
- After rising by 32% from May 2024 to May 2025 ‒ with the deficit from pre-pandemic levels falling to -13% ‒ inventory has begun to stall as sellers show signs of pulling back from the market
- Inventory edged lower in July on a seasonally adjusted basis, marking the first such decline in six months
- More than a third of major markets experienced seasonally adjusted inventory declines over the past two months, with some of the sharpest in Denver (-27%), San Francisco (-20%), San Jose (-20%), Seattle (-14%), Colorado Springs (-13%), Portland (-10%) and Austin (-9%)
- This mirrors 2023, when softening home prices stalled inventory growth, ultimately leading to a rebound in home-price appreciation
- That said, inventories are much higher now (+47%) than they were when the market began to shift back in 2022/2023, which could lead to softer prices
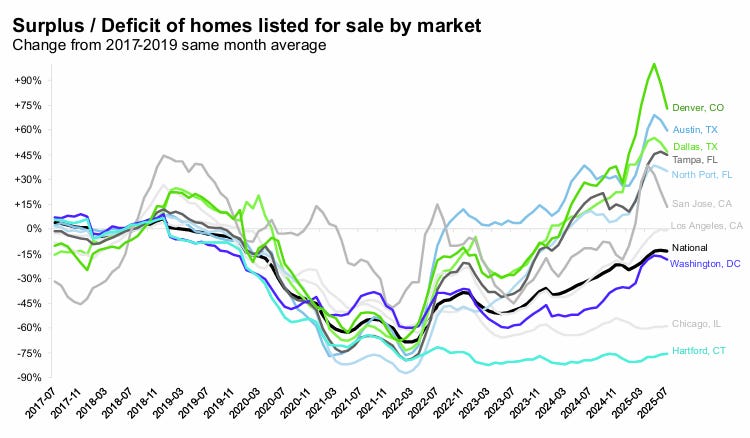
This graph illustrates the significant regional differences with inventory growth. The Northeast and Upper Midwest still have low levels of inventory. Meanwhile, prices are falling in part of Florida and Texas – and other cities with inventory above 2017 – 2019 levels.
Here is the ICE August Mortgage Monitor report (pdf).