Calculated Risk
Home Prices Off 5.5% from Peak NSA, Prices up 3.4% YoY
By Bill McBride
Note: The Black Knight House Price Index (HPI) is a repeat sales index. Black Knight reports the median price change of the repeat sales.
The Data & Analytics division of Black Knight, Inc. (NYSE:BKI) released its latest Mortgage Monitor Report, based on the company’s industry-leading mortgage, real estate and public records datasets. With both supply and demand in the housing market being impacted by a volatile interest rate environment, this month’s report looks at the continuing – and worsening – shortage in for-sale inventory and the role it is playing in keeping affordability tight and buoying home prices. As Black Knight Vice President of Enterprise Research Andy Walden explains, growing supply shortages are holding home prices higher than they otherwise would be given current affordability constraints, as elevated rates continue to lock would-be sellers in place.
“The interplay between inventory, home prices and interest rates has been the defining characteristic of the housing market for the last two years, and this continues to be the case,” said Walden. “Today, we see buyer demand dampened under pressure from rising rates and their impact on affordability, with purchase rate-lock volumes cooling in late February. However, when rates ticked down closer to 6% early in the month, we saw a rebound of buyside demand. On the other side of the equation, we’ve seen a consistent theme of potential sellers – many with first-lien rates a full 3 percentage points below today’s offerings – pulling back from putting their homes on the market. In fact, January marked the fourth consecutive monthly decline in overall for-sale inventory according to our Collateral Analytics data, with the primary driver being a 25-month stretch of new listing volumes running below pre-pandemic averages. While demand remains weak, faltering supply has resulted in months of available inventory stagnating near 3.1 in recent months. …
This month’s report draws further upon the Black Knight HPI – the timeliest and most granular in the industry – to look at January 2023 home price trends, finding that prices fell once again, pulling back by 0.24% from December 2022 and a more modest 0.13% on a seasonally adjusted basis. Though January marked the seventh consecutive month of falling home prices, the month’s decline was the smallest during that span. Home prices are now -5.5% off their June peak (or off -2.9% seasonally adjusted).
The annual home price growth rate – which tracks growth over the prior 12 months – fell to 3.4% in January. That is already more than a full percentage point below the 30-year average – and is on pace to fall below 0% by March/April. Price impacts could strengthen again if 30-year rates continue to climb as they have through late February, although tight inventory will put a floor on how much prices will ease.
emphasis added
House Prices Declined in January
Here is a graph of the Black Knight HPI. The index is still up 3.4% year-over-year but declined for the seventh consecutive month in January and is now 5.5% off the peak in June 2022.
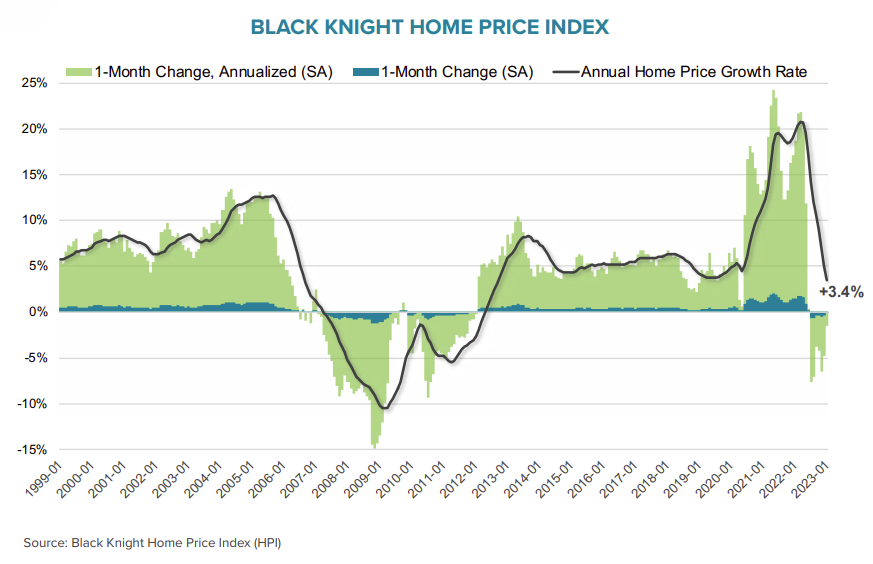
• Home prices fell again in January, pulling back by 0.24% from December and a more modest 0.13% on a seasonally adjusted basis
• That’s the smallest monthly decline in seven months, as falling interest rates and improving affordability in late 2022/early 2023 ran into tightening supply
• All in, home prices are now 5.5% off their June peak and a more modest 2.9% off peak when adjusting for typical seasonal trends
• The annual home price growth rate fell to 3.43% in January – more than a full percentage point below the 30-year average – and is on pace to fall below 0% by March/April
New Listings Down Sharply
And on new listings – comparing to the same month in the 2017 to 2019 period.
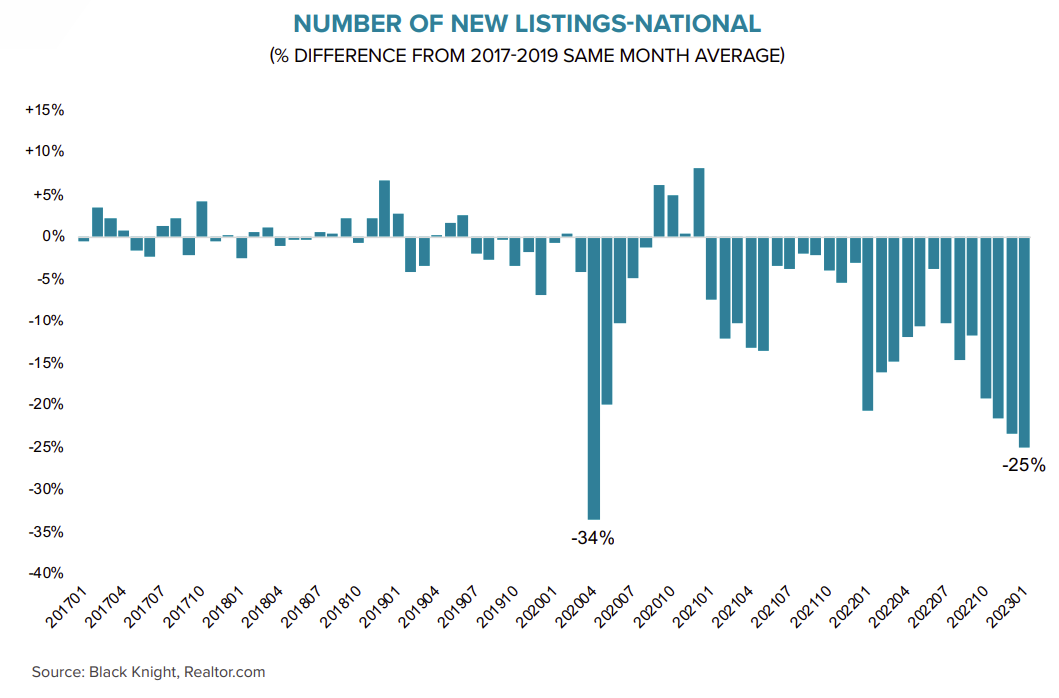
• New listing volumes have now run at a deficit from pre-pandemic averages for 25 consecutive months, with the largest deficits (outside of April 2020 when the bulk of the country was in lockdown) taking place in recent months
• There were 25% fewer homes listed for sale in January than normal, which is why inventory fell in the month despite home sales hitting a >7-year low
• With would-be home sellers currently sitting on the sidelines, inventory shortages could continue well into the foreseeable future
• The lack of active ARM [Adjustable Rate] loans in today’s market also limits rate-pressured sale activity, and is resulting in less supply than other countries that rely more heavily on ARM loans are seeing
emphasis added
Mortgage Delinquencies Decreased in January
Here is a graph on delinquencies from Black Knight. Overall delinquencies are near record lows.
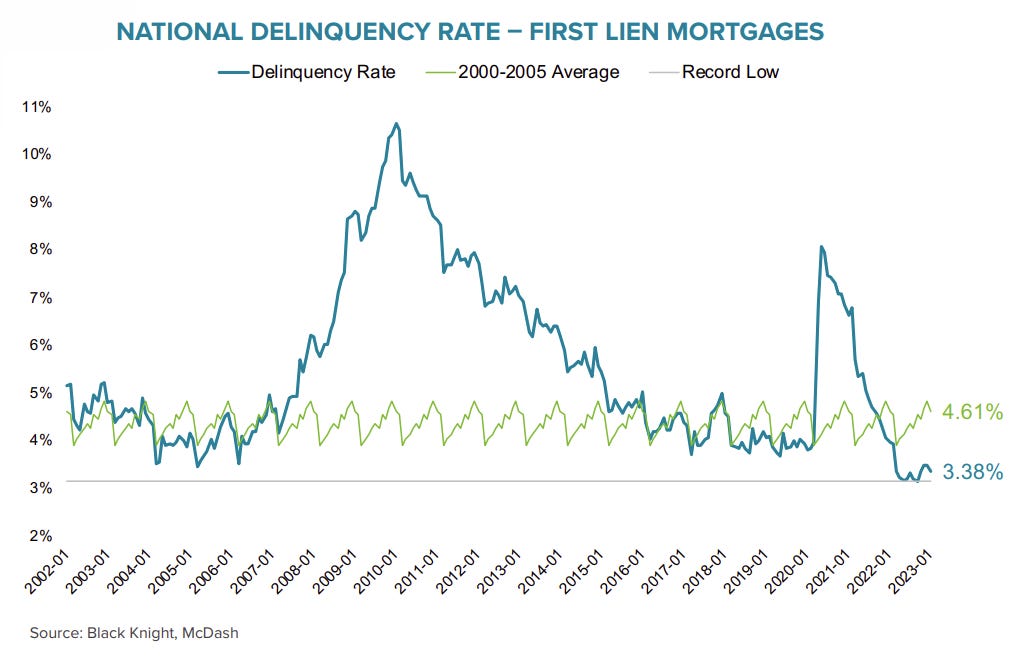
• At 3.38%, the national delinquency rate declined 10 bps in January and is now down 15% (60 bps) year over year
• January’s 2.9% decline in delinquencies was broad-based, led by a 4.8% drop in early stage delinquencies (30 days past due)
• 60-day and 90-day delinquencies both decreased slightly (0.8% and 0.6% respectively)
• Serious delinquencies (90+ days past due) continued to improve nationally, falling by 4K, with 44 states seeing volumes shrink in the month, while Florida added another 1.7K in the wake of Hurricane Ian
There is much more in the mortgage monitor.