Year-over-year “Price growth is expected to cross over into negative territory by April”
Calculated Risk
By Bill McBride
Press Release: Black Knight: February Home Prices See First Monthly Rise After Seven Straight Declines as Sales Pick Up on Lower Rates While Inventory Shrinks Even Further
Yesterday, the Data & Analytics division of Black Knight, Inc. (NYSE:BKI) released its latest Mortgage Monitor Report, based on the company’s industry-leading mortgage, real estate and public records datasets. After seeing home prices pull back for seven consecutive months at the national level, and likely spurred by homebuyers reacting to a dip in 30-year interest rates, the Black Knight Home Price Index showed something of a rebound occurring in many areas of the country in February. As Black Knight Vice President of Enterprise Research Andy Walden explains, a widespread shift occurred at the geographic level, with prices rising for the month in 78% of the 50 largest U.S. markets.
“February’s national increase in home prices – up 0.16%, adjusted for seasonality – marked the first positive monthly growth we’ve seen in 8 months,” said Walden. “Daily transaction info from Black Knight Collateral Analytics and our Optimal Blue rate lock data show that the purchase market increased when rates declined in the early part of the month and borrowers were quick to take advantage of limited inventory. In many areas of the country, that dynamic – low inventory and a modest rise in demand – led to an uptick in home prices. All in, 39 of the 50 largest U.S. markets saw prices increase in February – in sharp contrast to just three months earlier, when 48 of those 50 were experiencing price declines. While some price increases – most notably in Miami, which saw the largest of the month – can be chalked up to people moving to the area, we’re seeing stronger price gains more generally in those areas with better affordability and larger inventory deficits. Still, the backward-looking national annual home price growth rate continued its descent, falling to 1.94% – the first time we’ve seen it under 2% since 2012. While that national number is still on track to fall below 0% in April, if inventory challenges and easing interest rates persist, they may well push it back into positive territory later this year.
“The unfortunate reality is that the scarce supply of inventory that’s the source of so much market gridlock isn’t getting any better. In fact, seasonally adjusted inventory levels continued to deteriorate in February, marking not only the fifth straight month of such declines, but also the largest inventory deficit we’ve seen since May of last year, with more than 90% of markets seeing such deficits grow in February. New listings – already trending well below pre-pandemic levels for months – ran 27% below those levels in February as potential home sellers continued to shy away from the market. All in, total active for-sale inventory is back to 47% below pre-pandemic levels after having recovered to within 38% of normal levels late last year. Without a significant shift in interest rates, home prices or household income, this is a self-fulfilling dynamic that is quite likely to continue for some time.”.
emphasis added
House Prices Increased in February
Here is a graph of the Black Knight HPI. The index is still up 1.9% year-over-year and will likely turn negative YoY soon.
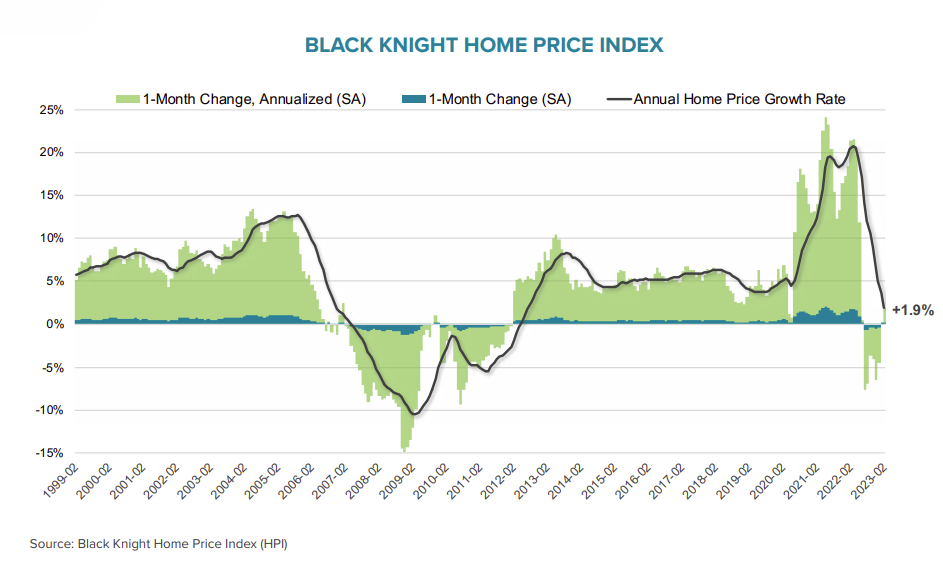
• A modest easing of affordability in January and early February along with tightening inventory levels drove home prices slightly higher
• On an adjusted basis, prices were up 0.16% for the month, the strongest single month gain since May of last year, while non-adjusted they were up 0.68%
• The headline annual home price growth rate fell by 164 bps in the month to 1.94%, the first time we’ve seen annual home price growth below 2% since early 2012
• Price growth is expected to cross over into negative territory by April but may return above 0% before the end of the year if inventory challenges persist and interest rates ease
• All in, home prices nationally are now down 2.6% from their 2022 peak, marginally improved from 2.7% in January
emphasis added
New Listings Down Sharply
And on new listings – comparing to the same month in the 2017 to 2019 period.
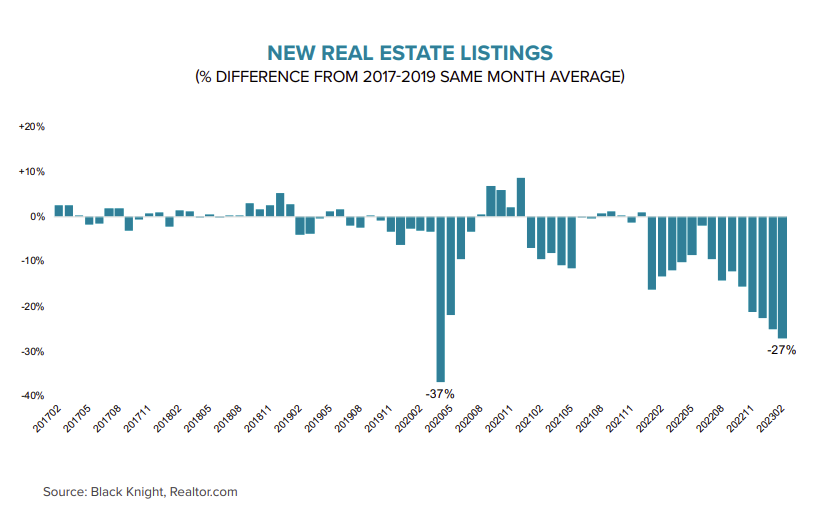
• New listings ran 27% below pre-pandemic levels — slightly worse than the 25% deficit in January — as existing home sellers continue to shy away from the market
• Active for-sale inventory levels are now back to 47% below pre-pandemic levels, after recovering to within 38% of normal levels late last year
• 91 of the top 100, or 47 of the top 50, saw their inventory (active listing count) decline in February
Mortgage Delinquencies Increased Slightly in February
Here is a graph on delinquencies from Black Knight. Overall delinquencies are near record lows.
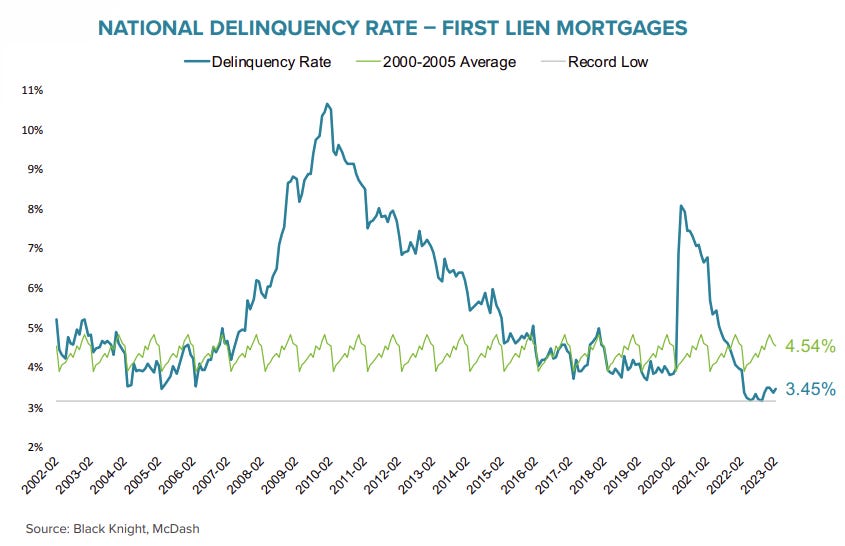
• At 3.45%, the national delinquency rate increased 7 bps in February, but is down 13% year over year
• February’s 2% increase in delinquencies was driven by a 7.1% rise in borrowers 30-days past due
• The 65K rise in the number of borrowers who became 30-days past due was partly offset by January’s 46K decline, leaving a net increase of 19K over two months
• In contrast, 60-day and 90-day delinquencies both declined (4% and 3%, respectively
• Looking ahead, March typically sees the strongest monthly improvement in mortgage delinquency rates, which fall by approximately 10% in the average year