Calculated Risk
“FHFA’s seasonally adjusted monthly index for December was down 0.1 percent from November”
Both the Case-Shiller House Price Index (HPI) and the Federal Housing Finance Agency (FHFA) HPI for December were released today. Here is a graph of the month-over-month (MoM) change in the Case-Shiller National Index Seasonally Adjusted (SA).
The Case-Shiller Home Price Indices for “December” is a 3-month average of October, November and December closing prices. October closing prices include some contracts signed in August, so there is a significant lag to this data.
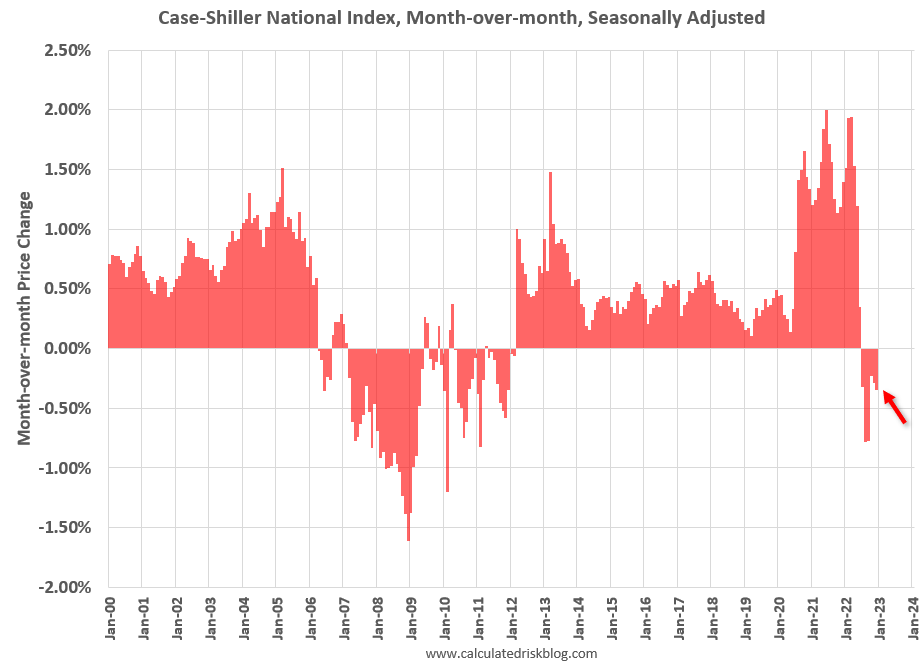
The MoM decrease in the seasonally adjusted Case-Shiller National Index was at -0.35%. This was the sixth consecutive MoM decrease, and a slightly larger decrease than in November.
On a seasonally adjusted basis, prices declined in all 20 Case-Shiller cities on a month-to-month basis. The largest monthly declines seasonally adjusted were in Las Vegas (-1.5%), Phoenix (-1.3%) and Portland (-1.3%). San Francisco has fallen 12.7% from the peak in May 2022 and was the first Case-Shiller city with a year-over-year decline (-4.2% year-over-year). Seattle is now down too at -1.8% YoY.
FHFA House Price Index
On the FHFA index: U.S. House Prices Rise 8.4 Percent over the Last Year; Up 0.3 Percent from the Third Quarter
U.S. house prices rose 8.4 percent between the fourth quarters of 2021 and 2022, according to the Federal Housing Finance Agency (FHFA) House Price Index (FHFA HPI®). House prices were up 0.3 percent compared to the third quarter of 2022. FHFA’s seasonally adjusted monthly index for December was down 0.1 percent from November.
“House price appreciation continued to wane in the fourth quarter” said Dr. Polkovnichenko, Supervisory Economist in FHFA’s Division of Research and Statistics. “House prices grew at a much slower pace in recent quarters amid higher mortgage rates and a decline in mortgage applications. These negative pressures were partially offset by historically low inventory.”
emphasis added
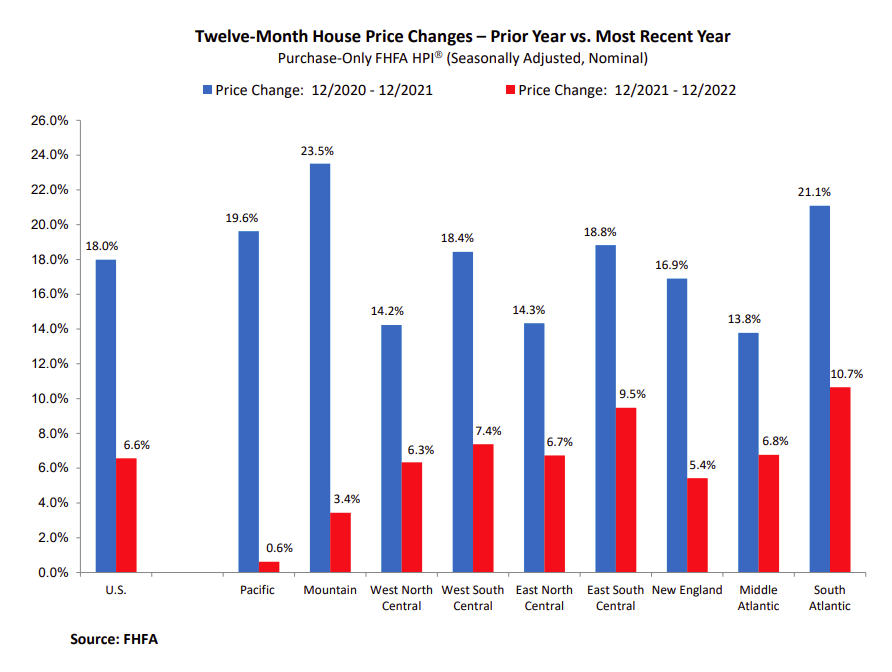
The monthly index declined 0.1% in December. Here is a graph from the FHFA report showing the annual change by region for December 2022 compared to December 2021. Prices have increased YoY everywhere. Note that the Year-over-year increase is smaller this year, compared to the YoY increase in December 2021 in all of the nine regions – especially in the Pacific and Mountain regions.
Case-Shiller House Prices
From S&P: S&P Corelogic Case-Shiller Index Continued to Decline in November
The S&P CoreLogic Case-Shiller U.S. National Home Price NSA Index, covering all nine U.S. census divisions, reported a 5.8% annual gain in December, down from 7.6% in the previous month. The 10- City Composite annual increase came in at 4.4%, down from 6.3% in the previous month. The 20-City Composite posted a 4.6% year-over-year gain, down from 6.8% in the previous month.
Miami, Tampa, and Atlanta reported the highest year-over-year gains among the 20 cities in December. Miami led the way with a 15.9% year-over-year price increase, followed by Tampa in second with a 13.9% increase, and Atlanta in third with a 10.4% increase. All 20 cities reported lower prices in the year ending December 2022 versus the year ending November 2022.
…
Before seasonal adjustment, the U.S. National Index posted a -0.8% month-over-month decrease in December, while the 10-City and 20-City Composites posted decreases of -0.8% and -0.9%, respectively.
After seasonal adjustment, the U.S. National Index posted a month-over-month decrease of -0.3%, and the 10-City and 20-City Composites posted decreases of -0.4% and -0.5%, respectively.
In December, all 20 cities reported declines both before and after seasonal adjustments.
“The cooling in home prices that began in June 2022 continued through year end, as December marked the sixth consecutive month of declines for our National Composite Index,” says Craig J. Lazzara, Managing Director at S&P DJI. “The National Composite declined by -0.8% in December, and now stands 4.4% below its June peak. For 2022 as a whole, the National Composite rose by 5.8%, the 15th best performance in our 35-year history, although obviously well below 2021’s record-setting 18.9% gain. We could record similar observations in the 10- and 20-City Composites.
“Prices fell in all 20 cities in December, with a median decline of -1.1%. Moreover, for all 20 cities, year-over-year gains in December (median 4.4%) were lower than those of November (median 6.4%). We noted last month that home prices in San Francisco had fallen on a year-over-year basis. San Francisco’s decline worsened in December (-4.2% year-over-year); its west coast neighbors Seattle (- 1.8%) and Portland (+1.1%) once again form the bottom of the league table.
emphasis added
This graph shows the nominal seasonally adjusted Composite 10, Composite 20 and National indices (the Composite 20 was started in January 2000).
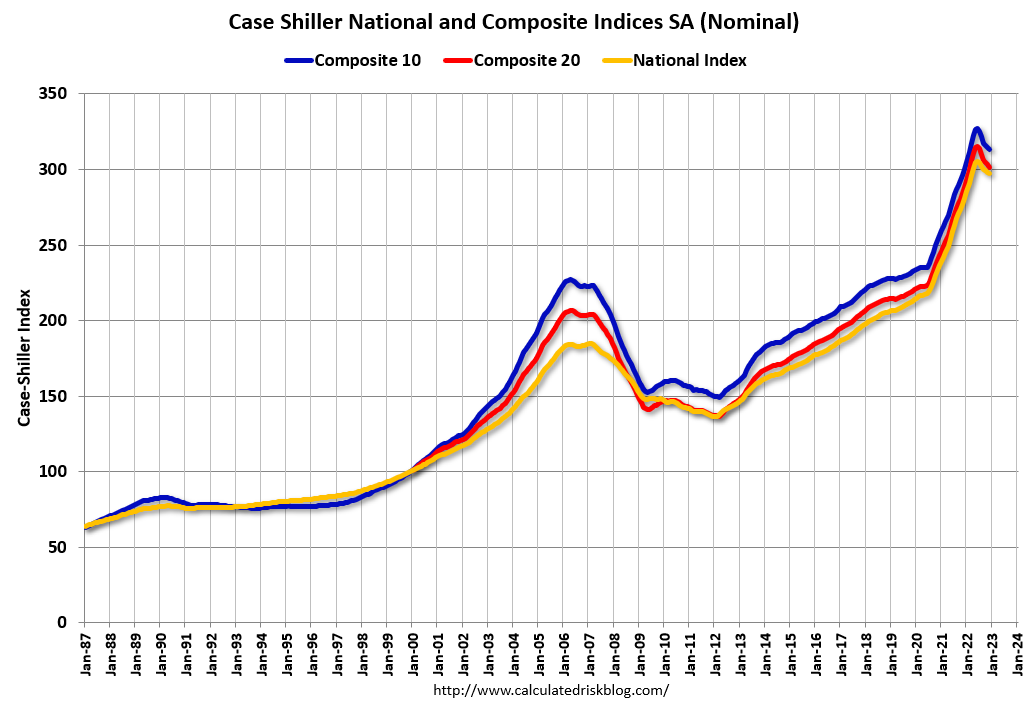
The Composite 10 index is down 0.4% in December (SA) and down 4.3% from the recent peak in June 2022. The Composite 20 index is down 0.5% (SA) in December and down 4.4% from the recent peak in June 2022. The National index is down 0.3% (SA) in December and is down 2.7% from the peak in June 2022.
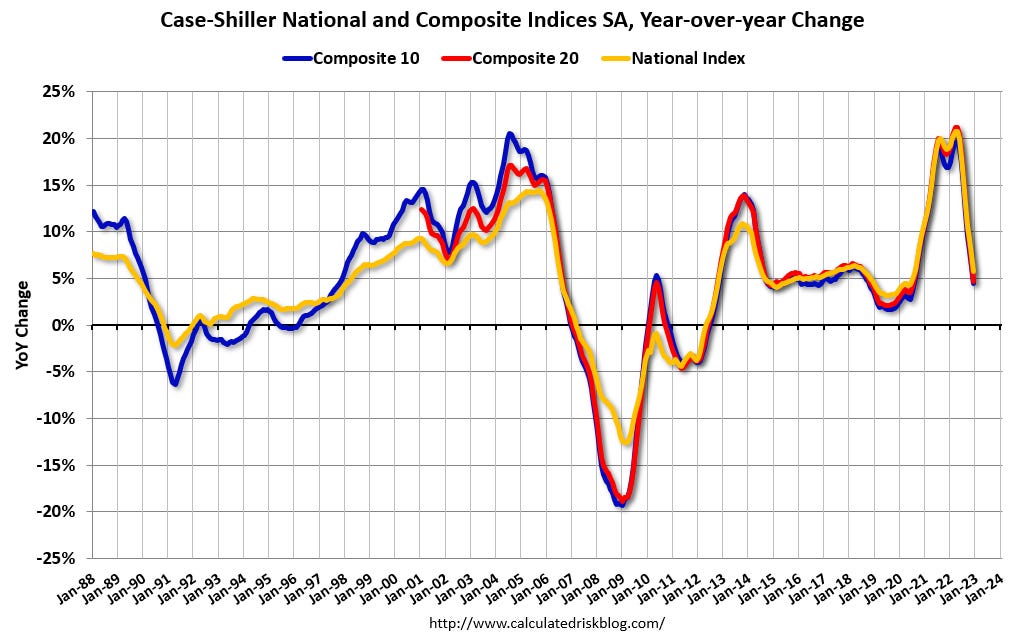
The Composite 10 SA is up 4.4% year-over-year. The Composite 20 SA is up 4.7% year-over-year. The National index SA is up 5.8% year-over-year.
House Prices and Inventory
This graph below shows existing home months-of-supply, inverted, from the National Association of Realtors® (NAR) vs. the seasonally adjusted month-to-month price change in the Case-Shiller National Index (both since January 1999 through December 2022). Note that the months-of-supply is not seasonally adjusted.
The last eight months are in black showing a possible shift in the relationship, and prices are now falling with low levels of inventory!
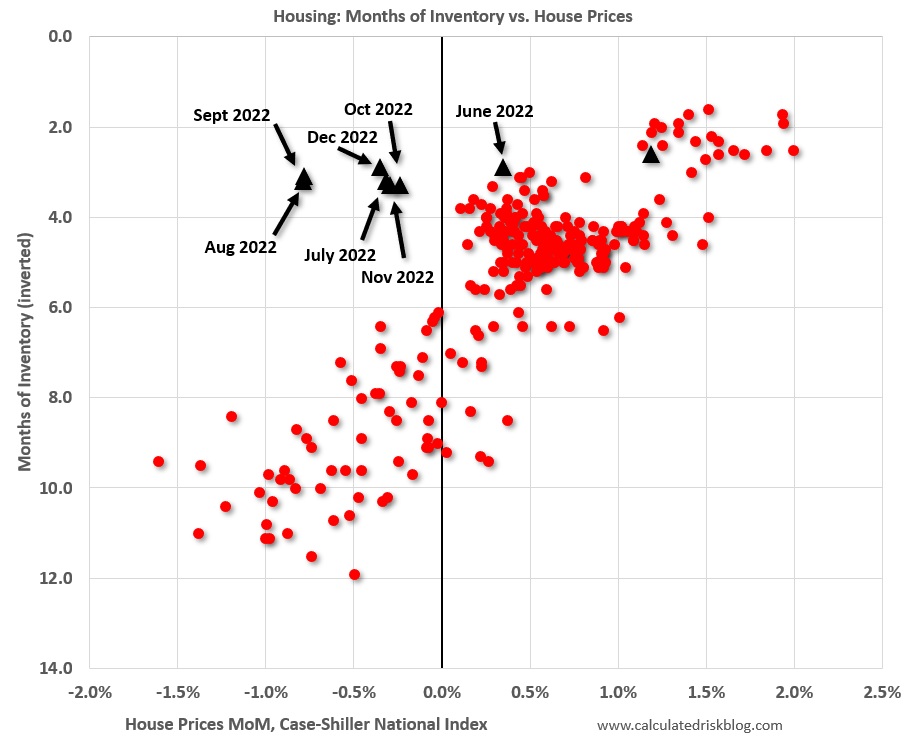
In December, the months-of-supply was at 3.3 months, and the Case-Shiller National Index (SA) decreased -0.35% month-over-month. The last six months appear to be outliers with prices falling even though months-of-supply is still somewhat low. Historically prices haven’t declined until inventory reached 6 months of supply. NOTE that the NAR appears to include some pending sales in their inventory, and inventory is probably up more than the NAR is reporting.
In the January existing home sales report, the NAR reported months-of-supply was unchanged at 2.9 months.
The year-over-year Case-Shiller house price increase was lower than expected.
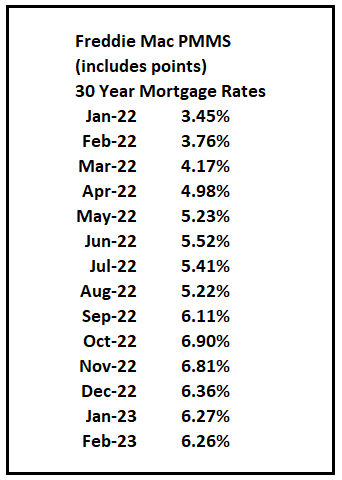
Here are the 30-year mortgage rates according to the Freddie Mac PMMS:
The December report was mostly for contracts signed in the August through November period – and was likely impacted by the surge in rates in October.
The impact from higher rates in October and November will negatively impact the Case-Shiller index over the next couple of months.
Note that mortgage rates increased towards the end of February and are now in the high 6% range.
Comparing to Median House Prices
Here is a comparison of year-over-year change in median house prices from the NAR and the year-over-year change in the Case-Shiller index. Median prices are distorted by the mix and repeat sales indexes like Case-Shiller and FHFA are probably better for measuring prices. However, in general, the Case-Shiller index follows the median price.
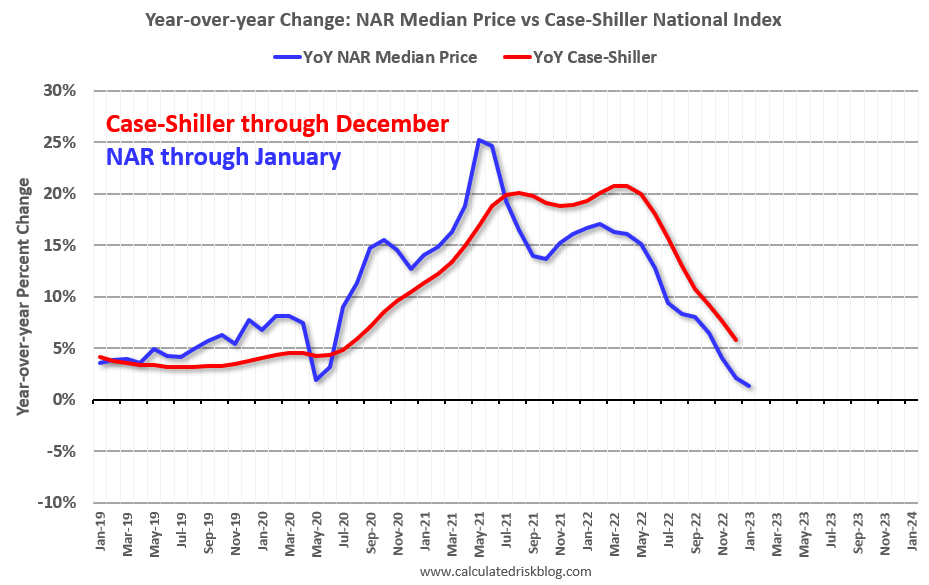
It is likely the median price will be down year-over-year soon – and Case-Shiller will follow.