“U.S. house prices rose in February, up 0.5 percent from January, according to the Federal Housing Finance Agency (FHFA) seasonally adjusted monthly House Price Index (HPI®).”
CALCULATED RISK
By Bill McBride
Both the Case-Shiller House Price Index (HPI) and the Federal Housing Finance Agency (FHFA) HPI for February were released today. Here is a graph of the month-over-month (MoM) change in the Case-Shiller National Index Seasonally Adjusted (SA).
The Case-Shiller Home Price Indices for “February” is a 3-month average of December, January and February closing prices. December closing prices include some contracts signed in October, so there is a significant lag to this data.

The MoM increase in the seasonally adjusted Case-Shiller National Index was at 0.16%. This increase followed seven consecutive MoM decreases.
On a seasonally adjusted basis, prices declined in 11 of 20 Case-Shiller cities on a month-to-month basis. The largest monthly declines seasonally adjusted were in Seattle (-1.5%), Las Vegas (-0.9%), and Portland (-0.4%). Seasonally adjusted, San Francisco has fallen 13.5% from the peak in May 2022 and Seattle is down 12.8% from the peak. All 20 cities have seen price declines from the recent peak (SA).
FHFA House Price Index
On the FHFA index: FHFA House Price Index Up 0.5 Percent in February; Up 4.0 Percent from Last Year
U.S. house prices rose in February, up 0.5 percent from January, according to the Federal Housing Finance Agency (FHFA) seasonally adjusted monthly House Price Index (HPI®). House prices rose 4.0 percent from February 2022 to February 2023. The previously reported 0.2 percent price increase for January 2023 was revised downward to a 0.1 percent increase.
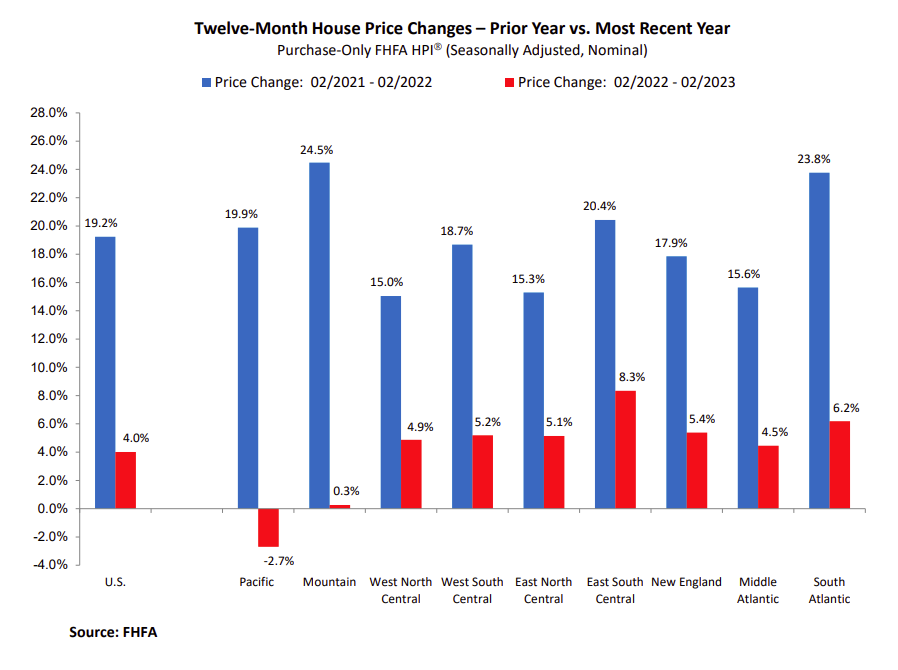
For the nine census divisions, seasonally adjusted monthly price changes from January 2023 to February 2023 ranged from -0.4 percent in the South Atlantic division to +2.3 percent in the East South Central division. The 12-month changes were -2.7 percent in the Pacific division to +8.3 percent in the East South Central division.
“U.S. house prices increased slightly in February,” said Dr. Nataliya Polkovnichenko, Supervisory Economist, in FHFA’s Division of Research and Statistics. “This increase was, in part, due to a decline in mortgage rates by more than half a percentage point from the peak reached in early November as well as historically low housing inventory.”
emphasis added
The monthly index increased 0.5% in February. Here is a graph from the FHFA report showing the annual change by region for February 2023 compared to February 2022. Prices have decreased YoY in the Pacific region but are up YoY everywhere else. Note that the Year-over-year increase is smaller this year, compared to the YoY increase in February 2022 in all of the nine regions – especially in the Pacific and Mountain regions.
Case-Shiller House Prices
From S&P: S&P Corelogic Case-Shiller Index Declines Moderated in February
The S&P CoreLogic Case-Shiller U.S. National Home Price NSA Index, covering all nine U.S. census divisions, reported a 2.0% annual gain in February, down from 3.7% in the previous month. The 10-City Composite annual increase came in at 0.4%, down from 2.5% in the previous month. The 20-City Composite posted a 0.4% year-over-year gain, down from 2.6% in the previous month.
Miami, Tampa, and Atlanta again reported the highest year-over-year gains among the 20 cities in February. The order remained the same with Miami leading the way with a 10.8% year-over-year price increase, followed by Tampa in second with a 7.7% increase, and Atlanta in third with a 6.6% increase. All 20 cities reported lower prices in the year ending February 2023 versus the year ending January 2023.
…
Before seasonal adjustment, the U.S. National Index posted a 0.2% month-over-month increase in February, while the 10-City and 20-City Composites posted increases of 0.3% and 0.2%, respectively.
After seasonal adjustment, the U.S. National Index posted a month-over-month increase of 0.2%, while both the 10-City and 20-City Composites posted increases of 0.1%.
In January, before seasonal adjustment, 19 cities reported declines with only Miami reporting an increase at 0.1%. After seasonal adjustment, 15 cities reported declines while Miami, Boston, Charlotte, and Cleveland had slight increases.
“Home price trends moderated in February 2023,” says Craig J. Lazzara, Managing Director at S&P DJI. “The National Composite, which had declined for seven consecutive months, rose a modest 0.2% in February, and now stands 4.9% below its June 2022 peak. Our 10- and 20-City Composites performed similarly, with February gains of 0.3% and 0.2%; these Composites are currently 6.0% and 6.6% below their respective peaks. On a trailing 12-month basis, the National Composite is only 2.0% above its level in February 2022; the 10- and 20-City Composites are both up 0.4% on a year-over-year basis.”
emphasis added
This graph shows the nominal seasonally adjusted Composite 10, Composite 20 and National indices (the Composite 20 was started in January 2000).
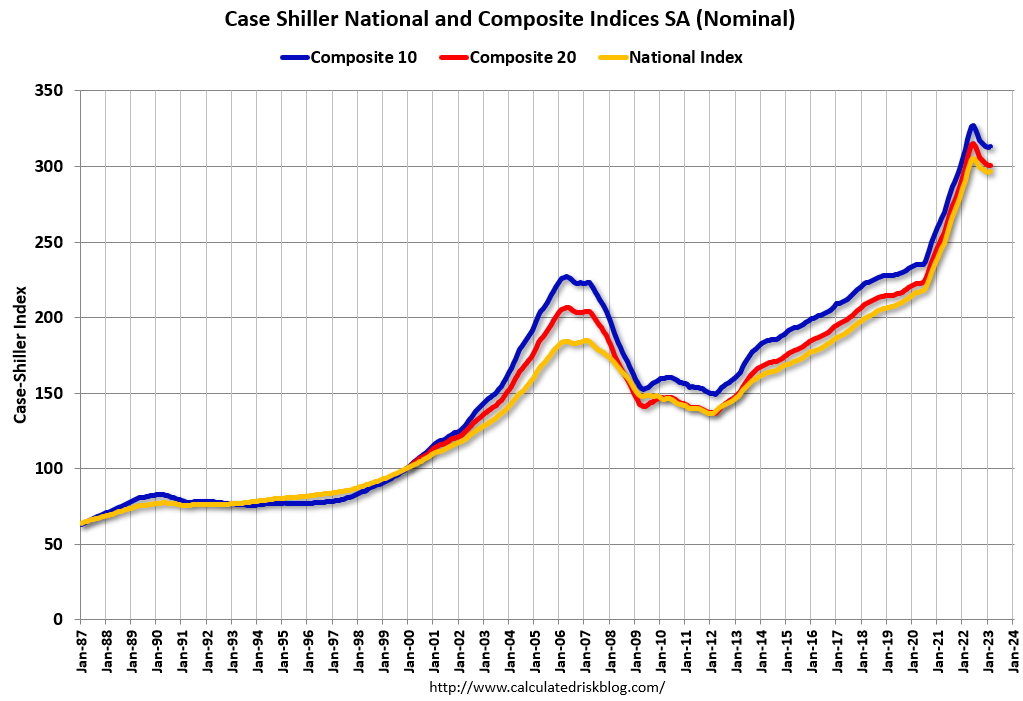
The Composite 10 index is up 0.1% in February (SA) and down 4.3% from the recent peak in June 2022. The Composite 20 index is up 0.1% (SA) in February and down 4.6% from the recent peak in June 2022. The National index is up 0.2% (SA) in February and is down 2.8% from the peak in June 2022.
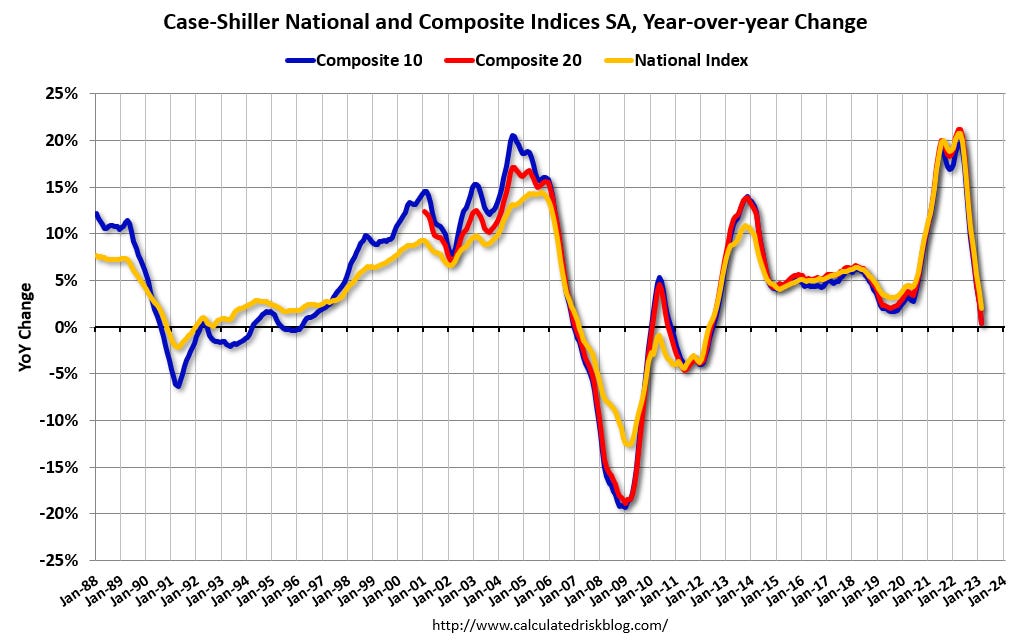
The Composite 10 SA is up 0.4% year-over-year. The Composite 20 SA is up 0.4% year-over-year. The National index SA is up 2.0% year-over-year.
House Prices and Inventory
This graph below shows existing home months-of-supply, inverted, from the National Association of Realtors® (NAR) vs. the seasonally adjusted month-to-month price change in the Case-Shiller National Index (both since January 1999 through January 2023). Note that the months-of-supply is not seasonally adjusted.
The last ten months are in black showing a shift in the relationship, and prices have fallen with low levels of inventory!
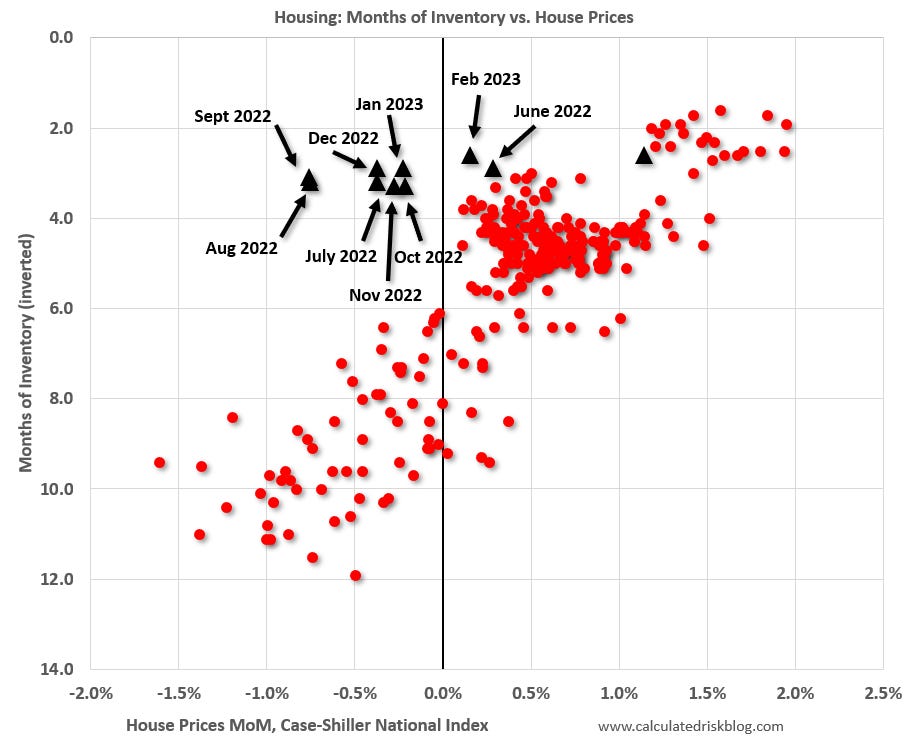
In February, the months-of-supply was at 2.6 months, and the Case-Shiller National Index (SA) increased 0.16% month-over-month. Historically prices haven’t declined until inventory reached 6 months of supply. NOTE that the NAR appears to include some pending sales in their inventory, and inventory is probably up more than the NAR is reporting.
In the March existing home sales report, the NAR reported months-of-supply was unchanged 2.6 months.
The year-over-year Case-Shiller house price increase was below expectations.
Here are the 30-year mortgage rates according to the Freddie Mac PMMS:
The February report was mostly for contracts signed in the October through January period – and was likely impacted by the surge in rates in October.

Note that mortgage rates increased in March, but that will not impact the Case-Shiller index for many months.
Comparing to Median House Prices
Here is a comparison of year-over-year change in median house prices from the NAR and the year-over-year change in the Case-Shiller index. Median prices are distorted by the mix and repeat sales indexes like Case-Shiller and FHFA are probably better for measuring prices. However, in general, the Case-Shiller index follows the median price.
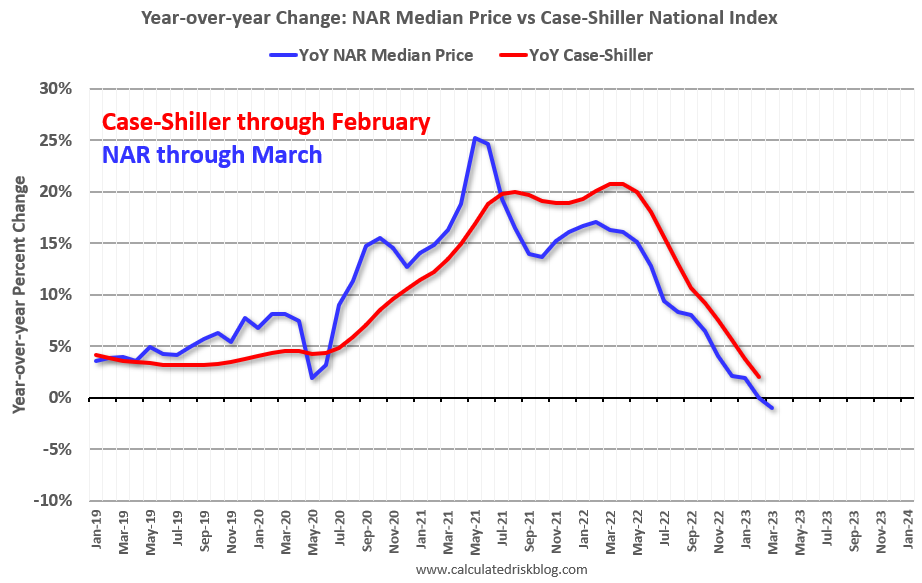
The median price was down 0.9% year-over-year in March, and Case-Shiller will likely be down year-over-year soon.