CALCULATEDRISK
By Bill McBride
FHFA House Prices up 1.6% YoY in January
S&P/Case-Shiller released the monthly Home Price Indices for January (“January” is a 3-month average of November, December and January closing prices). November closing prices include some contracts signed in September, so there is a significant lag to this data. Here is a graph of the month-over-month (MoM) change in the Case-Shiller National Index Seasonally Adjusted (SA).
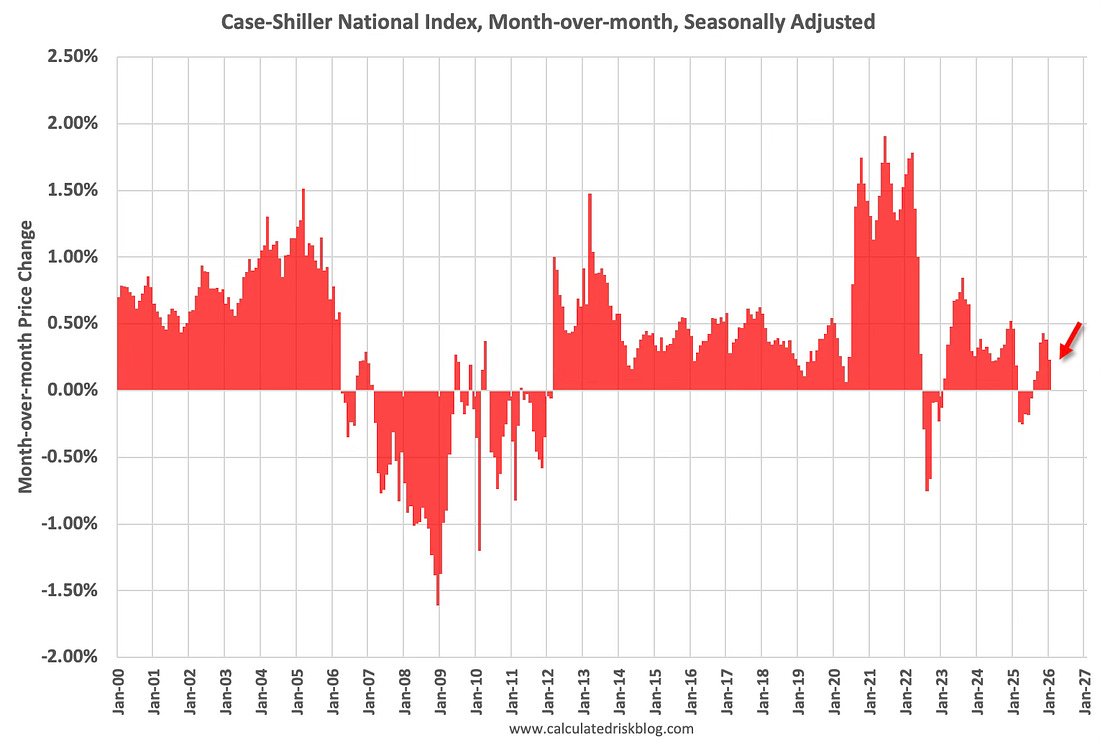
The National index increased 0.23% month-over-month (MoM) seasonally adjusted, This is the 6th consecutive month with a MoM increase seasonally adjusted that followed 5 consecutive months with a MoM decline.
FHFA House Price Index Up 1.6% Year-over-year in January
On the FHFA index: FHFA House Price Index® Up 0.1 Percent in January; Up 1.6 Percent from Last Year
U.S. house prices rose 0.1 percent in January, according to the U.S. Federal Housing (FHFA) seasonally adjusted monthly House Price Index (FHFA HPI®). House prices rose 1.6 percent from January 2025 to January 2026. The previously reported 0.1 percent price change in December was revised upward to 0.3 percent.
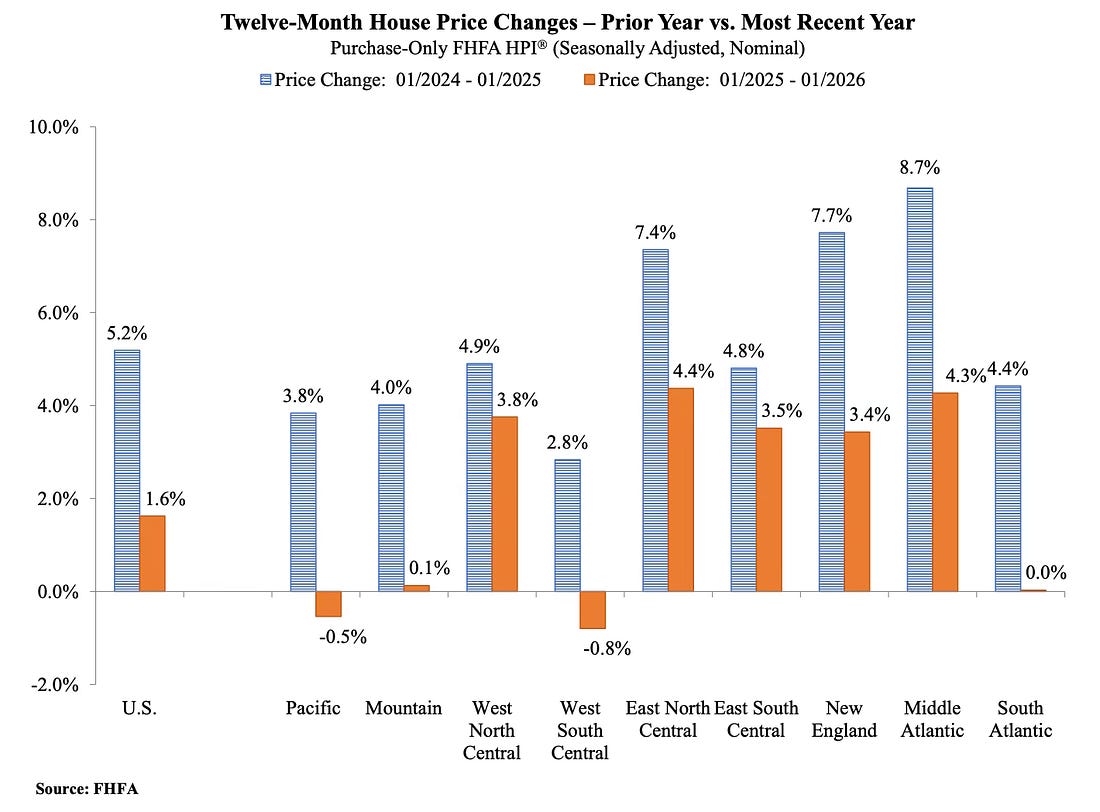
For the nine census divisions, seasonally adjusted monthly home price changes ranged from -0.7 percent in the West South Central division to +1.7 percent in the East South Central division. The 12-month changes ranged from -0.8 percent in the West South Central division to +4.4 percent in the East North Central division.
emphasis added
Here is a graph from the FHFA report comparing the annual change by region for January 2026 and 2025.
As expected, we are seeing significant regional differences.
Case-Shiller House Prices
From S&P S&P Cotality Case-Shiller Index Reports Annual Gain in January 2026
• The S&P Cotality Case-Shiller U.S. National Home Price NSA Index posted a 0.9% annual gain for January 2026, down from a 1.1% rise in the previous month.
• For the eighth consecutive month, inflation outpaced national home price appreciation, with CPI running 1.5 percentage points above the 0.9% annual gain — leaving real home values modestly lower year over year.
•Geographic divergence persisted, with New York (+4.9%), Chicago (+4.6%), and Cleveland (+3.6%) leading all markets while Tampa extended its decline to -2.5% year over year …
“January’s results show home price gains continuing to cool, with the U.S. National Index up 0.9% year over year — down from 1.1% in the prior month,” said Nicholas Godec, CFA, CAIA, CIPM, Head of Fixed Income Tradables & Commodities at S&P Dow Jones Indices. “The 10-City and 20-City Composites followed the same path, easing to 1.7% and 1.2%, respectively, from 2.0% and 1.4% the prior month. Price levels remain elevated, but the rate of appreciation has slowed materially.“Splitting the year into two halves sharpens the picture,” Godec continued. “The National Index rose 2.2% over the first six months of the period, then fell 1.3% over the most recent six — a swing that explains why annual gains have compressed to under 1% despite prices remaining historically elevated.
…
The S&P Cotality Case-Shiller U.S. National Home Price NSA Index, covering all nine U.S. census divisions, reported a 0.9% annual gain for January. The 10-City Composite saw an annual increase of 1.7%, down from a 2.0% increase in the previous month. The 20-City Composite posted a year-over-year increase of 1.2%, down from a 1.4% rise in the previous month.
…
The pre-seasonally adjusted U.S. National Index and the 20-City Composite Index saw a drop of 0.1% and the 10-City Composite decreased 0.03%.After seasonal adjustment, the U.S. National, 10-City Composite, and 20-City Composite Indices each reported a monthly increase of 0.2%.
emphasis added
This graph shows the nominal seasonally adjusted Composite 10, Composite 20 and National indices (the Composite 20 was started in January 2000).
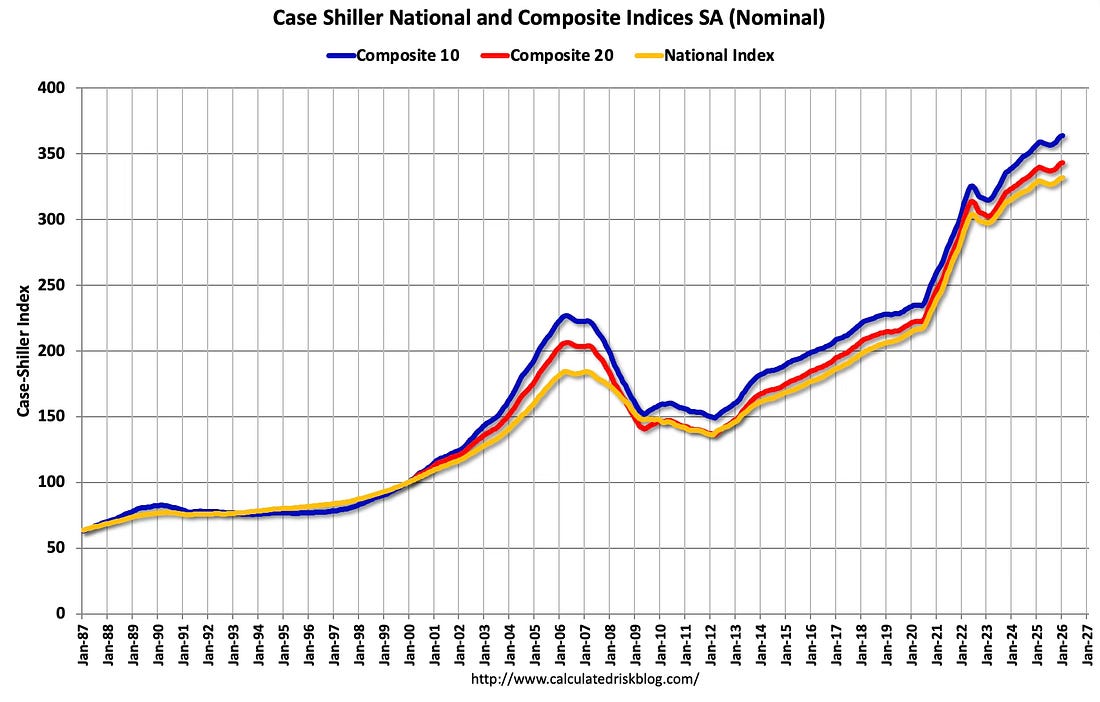
The Composite 10 index was up 0.2% in December(SA). The Composite 20 index was up 0.2% (SA) in December. The National index was up 0.2% (SA) in December.
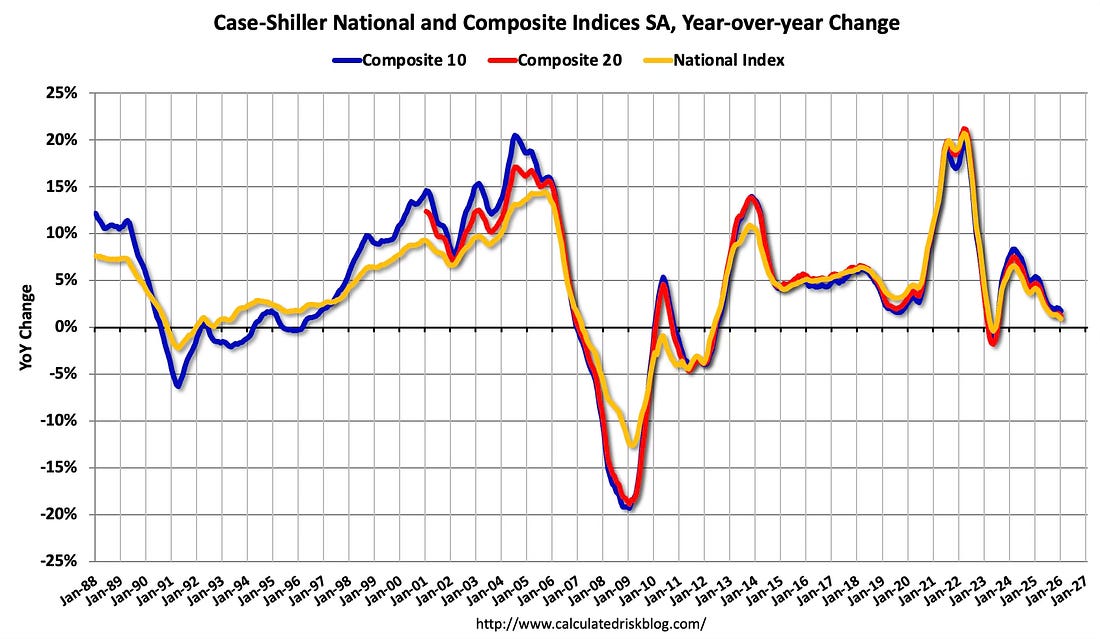
The Composite 10 NSA was up 1.7% year-over-year. The Composite 20 NSA was up 1.2% year-over-year. The National index NSA was up 0.9% year-over-year.
Annual price changes were slightly below expectations.
And a few things to watch …
House Prices and Inventory
This graph below shows existing home months-of-supply, inverted, from the National Association of Realtors® (NAR) vs. the seasonally adjusted month-to-month price change in the Case-Shiller National Index (both since January 1999 through January 2026). Note that the months-of-supply is not seasonally adjusted.
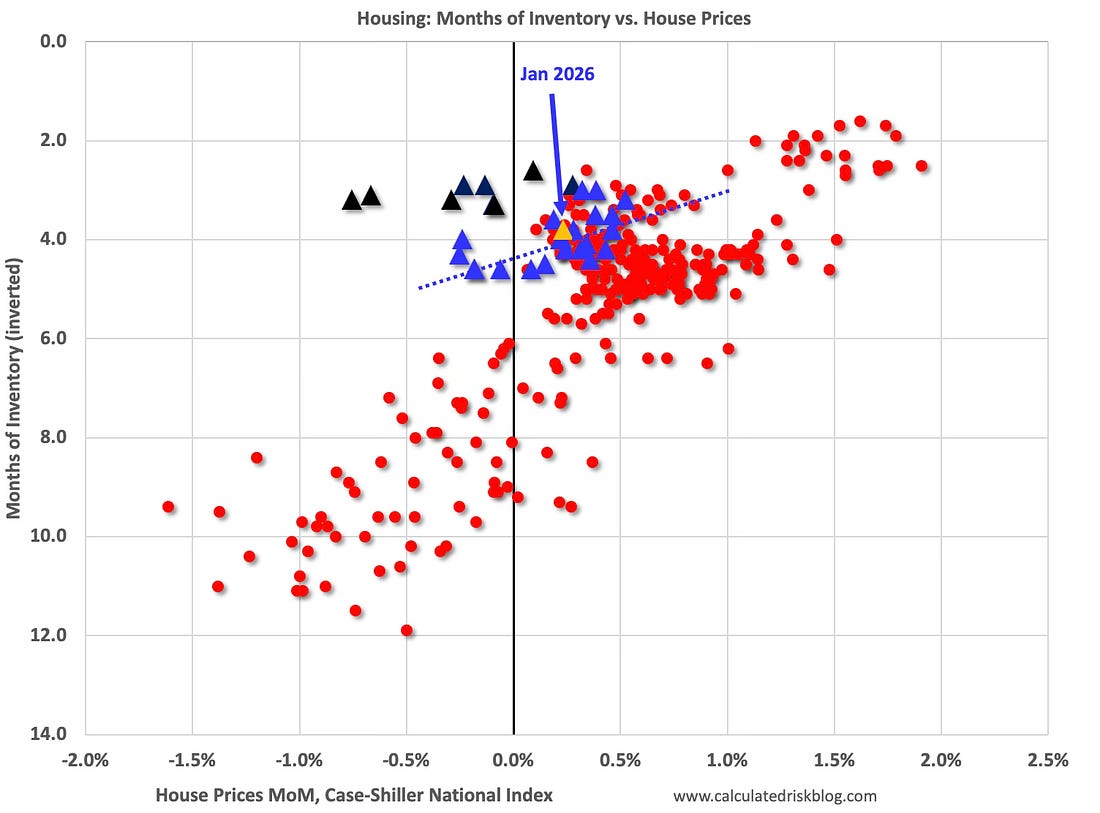
From June 2022 through February 2023, the months are in black showing that prices fell for seven months with low levels of inventory in 2022! The key reasons that prices fell in that period – even with low levels of inventory – was the rapid increase in mortgage rates (and monthly payments), and the mid-2022 surge in inventory. Some potential sellers quickly listed their homes, probably remembering what happened with house prices in the 2006 to 2011 period, but that inventory surge ended pretty quickly.
In January (Orange), the months-of-supply was at 3.8 months, and the Case-Shiller National Index (SA) increased 0.23% month-over-month. Historically prices haven’t declined until inventory reached 6 months of supply. However, the general trend over the last year (blue dashed line) suggests we might see national price declines with inventory less than 5 months of supply.
In the February existing home sales report, the NAR reported months-of-supply increased to 3.8 months NSA. Note that there are significant regional differences in both inventory and house prices.
Mortgage Rates
Here are the weekly 30-year mortgage rates according to the Freddie Mac PMMS since January 2020.
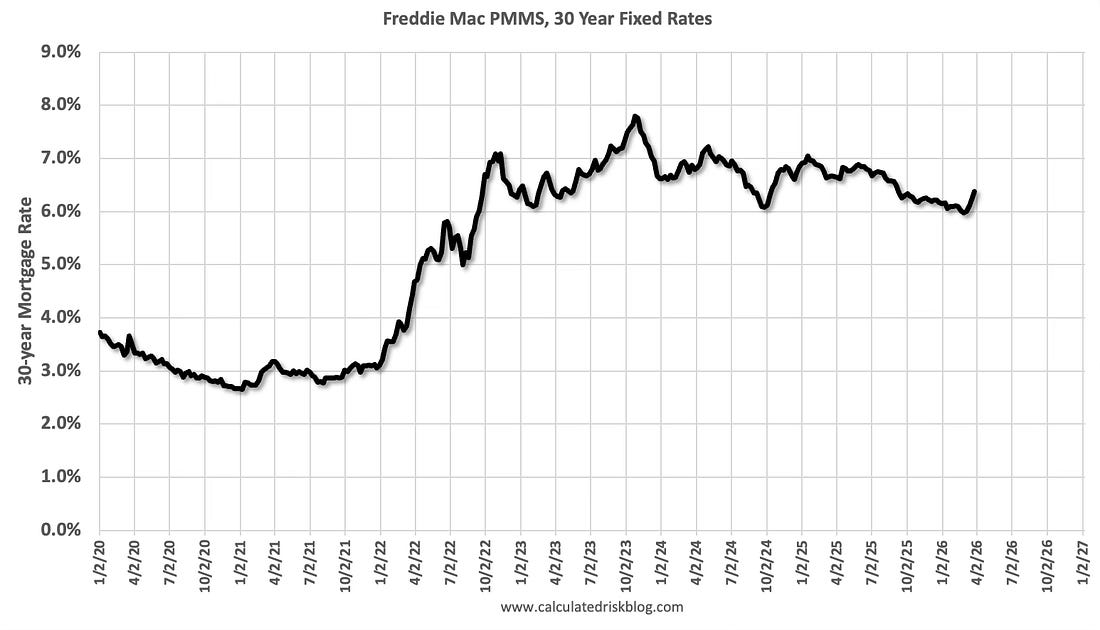
The January Case-Shiller report was mostly for contracts signed in the September through December period when 30-year mortgage rates average around 6.25%.
Rates have increased recently due to the war. I’ve been saying for a few years that the 6% to 7% range for 30-year mortgages is the “new normal”. No one should expect rates to drop into the low 5% range (or lower) without a recession or another crisis.
Comparing to Median House Prices
Here is a comparison of year-over-year change in median house prices from the NAR and the year-over-year change in the Case-Shiller index. Median prices are distorted by the mix and repeat sales indexes like Case-Shiller and FHFA are probably better for measuring prices. However, in general, the Case-Shiller index follows the median price.
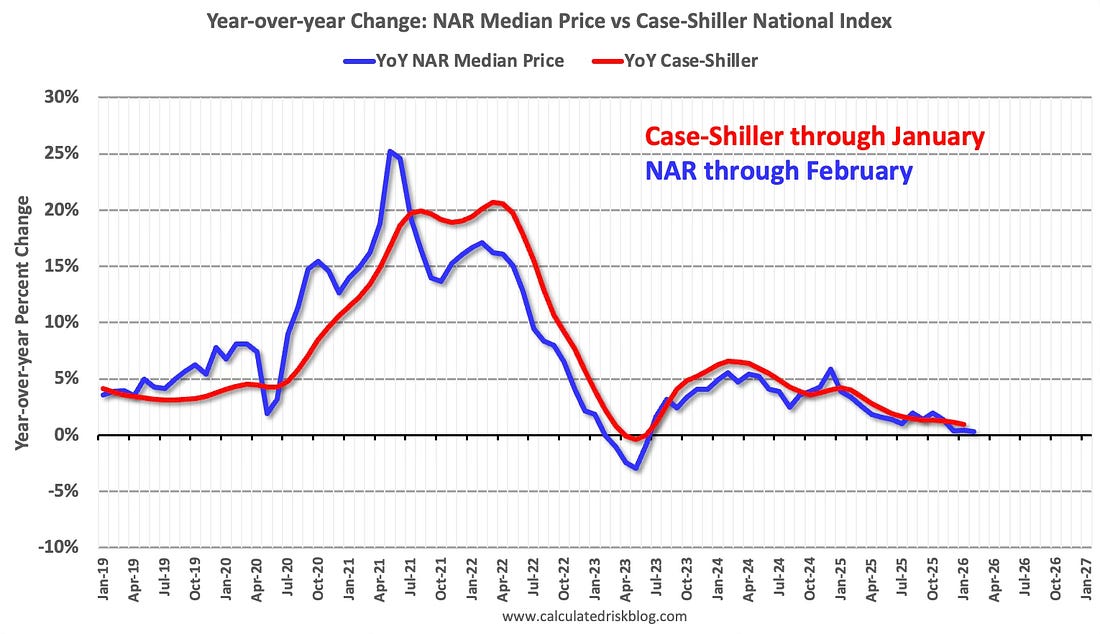
The median price was up 0.3% year-over-year in February, down from 0.4% YoY in January, andthe Case-Shiller National Index was up 0.9% year-over-year in the January report. This suggests the Case-Shiller index will likely be about the same or slightly lower year-over-year in the February report compared to January.
Annual price changes were slightly below expectations..
Note that the seasonally adjusted month-over-month Case-Shiller price was somewhat weaker in February 2025 (up 0.19% month-over-month in February 2025), before declining in the March through July 2025 period.
Inventory and months-of-supply will be the key metrics to watch for house prices.