CALCULATEDRISK
By Bill McBride
FHFA House Prices up 1.7% YoY in October
S&P/Case-Shiller released the monthly Home Price Indices for October (“October” is a 3-month average of August, September and October closing prices). August closing prices include some contracts signed in June, so there is a significant lag to this data. Here is a graph of the month-over-month (MoM) change in the Case-Shiller National Index Seasonally Adjusted (SA).
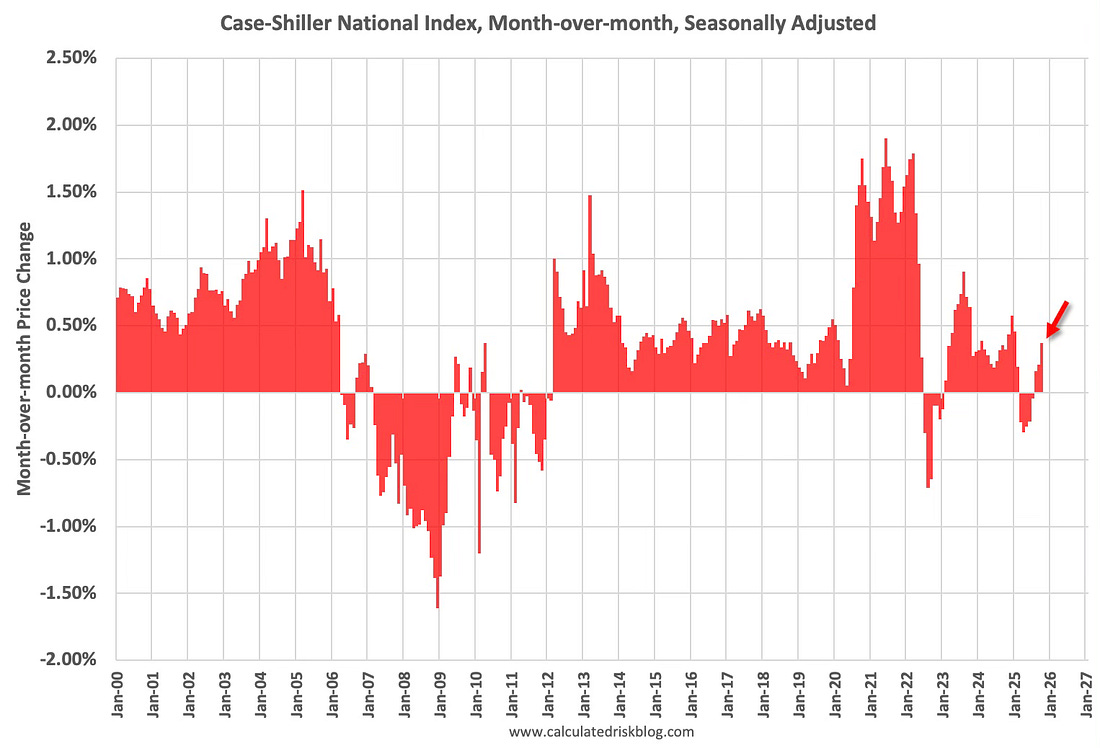
The National index increased 0.37% month-over-month (MoM). This is the 3rd consecutive month with a MoM increase seasonally adjusted that followed 5 consecutive months with a MoM decline.
FHFA House Price Index Up 1.7% Year-over-year in October
On the FHFA index: FHFA House Price Index® Up 0.4 Percent in October; Up 1.7 Percent from Last Year
U.S. house prices rose 0.4 percent in October, according to the U.S. Federal Housing (FHFA) seasonally adjusted monthly House Price Index (FHFA HPI®). House prices rose 1.7 percent from October 2024 to October 2025. The previously reported 0.0 percent price change in September was revised downward to a 0.1 percent decline.
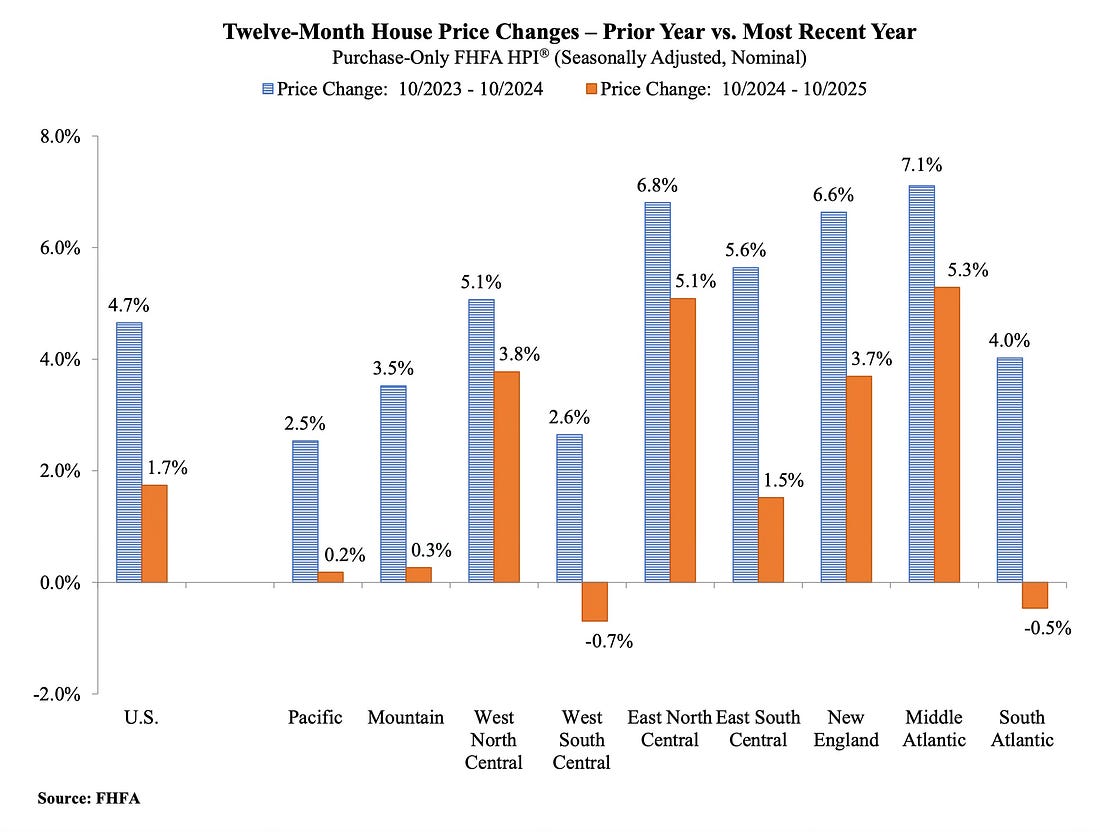
For the nine census divisions, seasonally adjusted monthly home price changes ranged from -0.4 percent in the East South Central division to +1.0 percent in the West South Central division. The 12-month changes ranged from -0.7 percent in the West South Central division to +5.3 percent in the Middle Atlantic division.
emphasis added
Here is a graph from the FHFA report comparing the annual change by region for October 2025 and 2024.
As expected, we are seeing YoY price declines in two regions and another two regions with little change YoY. There are significant regional differences.
Case-Shiller House Prices
From S&P S&P Cotality Case-Shiller Index Records Annual Gain in October 2025
• The S&P Cotality Case-Shiller U.S. National Home Price NSA Index posted a 1.4% annual gain for October, up from a 1.3% rise in the previous month.
• Regional divergence persists as Midwestern and Northeastern markets, led by Chicago (5.8%) and New York (5.0%), outpaced Sun Belt cities like Tampa (–4.2%) and Phoenix (–1.5%).
• Sixteen of 20 markets declined month-over-month in October, signaling broad stagnation as high mortgage rates weigh on affordability and suppress price momentum.
…
“October’s data show the housing market settling into a much slower gear, with the National Composite Index up only about 1.4% year over year – among the weakest performances since mid-2023,” said Nicholas Godec, CFA, CAIA, CIPM, Head of Fixed Income Tradables & Commodities at S&P Dow Jones Indices. “This figure is essentially unchanged from September’s 1.3% annual gain and represents less than a third of the 5.1% average home price increase recorded in 2024. National home prices also continue to lag consumer inflation, as October’s CPI is estimated around 3.1% (based on a provisional index the U.S. Treasury announced due to the federal data shutdown) – roughly 1.8 percentage points higher than the latest housing appreciation. In real terms, that gap implies a slight decline in inflation-adjusted home values over the past year.
“Regional performance underscores a striking geographic rotation. Chicago now leads all major markets with a 5.8% annual price gain, followed by New York at 5.0% and Cleveland at 4.1%. These traditionally stable Midwestern and Northeastern metros have sustained solid growth even as broader conditions soften. By contrast, Tampa home prices are down 4.2% year over year – the steepest drop among the 20 cities, marking Tampa’s 12th consecutive month of annual declines. Other former high- flyers in the Sun Belt are similarly struggling: Phoenix (-1.5%), Dallas (-1.5%), and Miami (-1.1%) all remain in negative territory. It’s a stark reversal from the pandemic boom, as the markets that were once ‘pandemic darlings’ are now seeing the sharpest corrections while more traditional metros continue to post modest gains.
…
The S&P Cotality Case-Shiller U.S. National Home Price NSA Index, covering all nine U.S. census divisions, reported a 1.4% annual gain for October, up from a 1.3% rise in the previous month. The 10- City Composite showed an annual increase of 1.9%, down from a 2.0% increase in the previous month. The 20-City Composite posted a year-over-year increase of 1.3%, down from a 1.4% increase in the previous month.
…
The pre-seasonally adjusted U.S. National, 10-City Composite, and 20-City Composite Indices continued to report negative month-over-month changes in October, posting a -0.3% drop for the 20- City Composite Index and -0.2% decreases for both the 10-City Composite and U.S. National Indices.
After seasonal adjustment, the U.S. National Index reported a monthly increase of 0.4% and both the 10-City Composite and 20-City Composite Indices posted month-over-month gains of 0.3%.
emphasis added
This graph shows the nominal seasonally adjusted Composite 10, Composite 20 and National indices (the Composite 20 was started in January 2000).
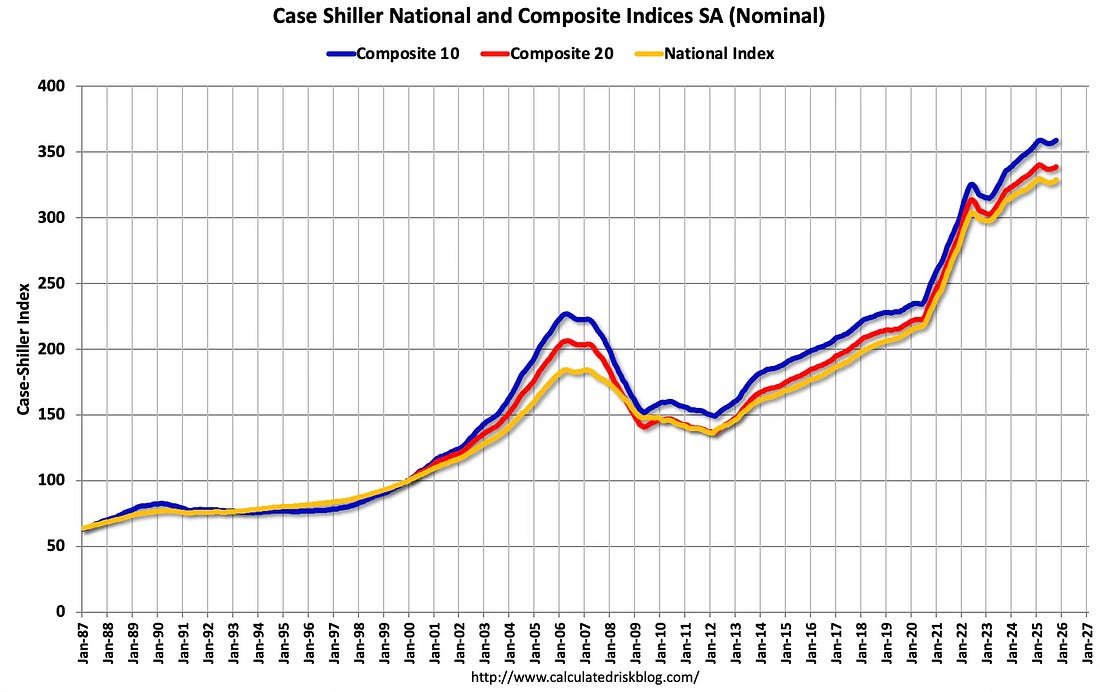
The Composite 10 index was up 0.3% in October (SA). The Composite 20 index was up 0.3% (SA) in October. The National index was up 0.4% (SA) in October.
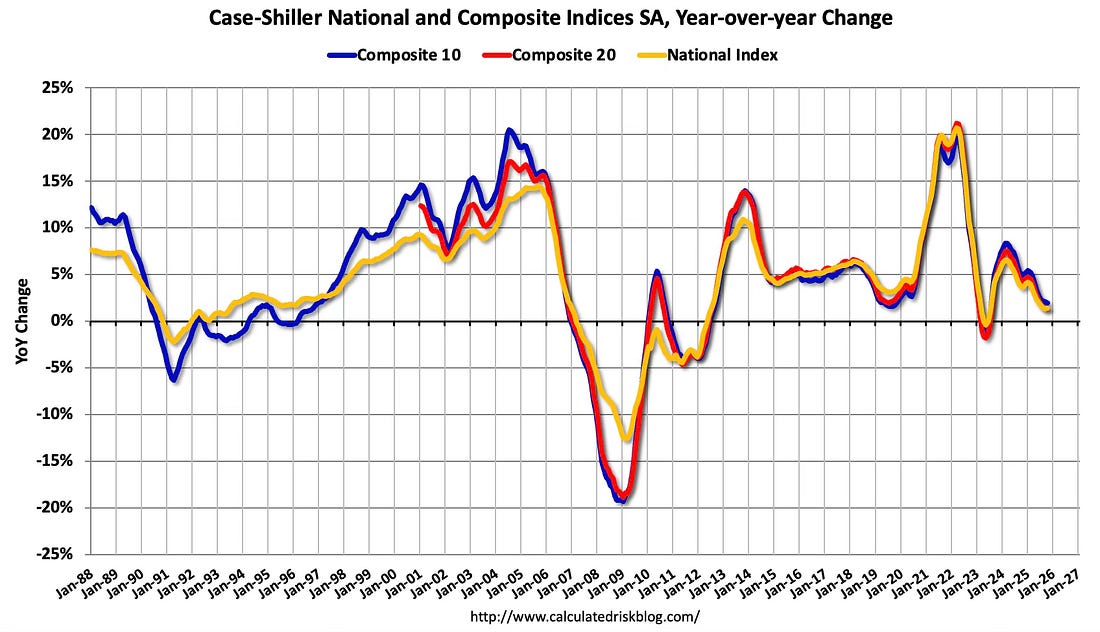
The Composite 10 NSA was up 1.9% year-over-year. The Composite 20 NSA was up 1.3% year-over-year. The National index NSA was up 1.4% year-over-year.
Annual price changes were at expectations.
And a few things to watch …
House Prices and Inventory
This graph below shows existing home months-of-supply, inverted, from the National Association of Realtors® (NAR) vs. the seasonally adjusted month-to-month price change in the Case-Shiller National Index (both since January 1999 through October 2025). Note that the months-of-supply is not seasonally adjusted.
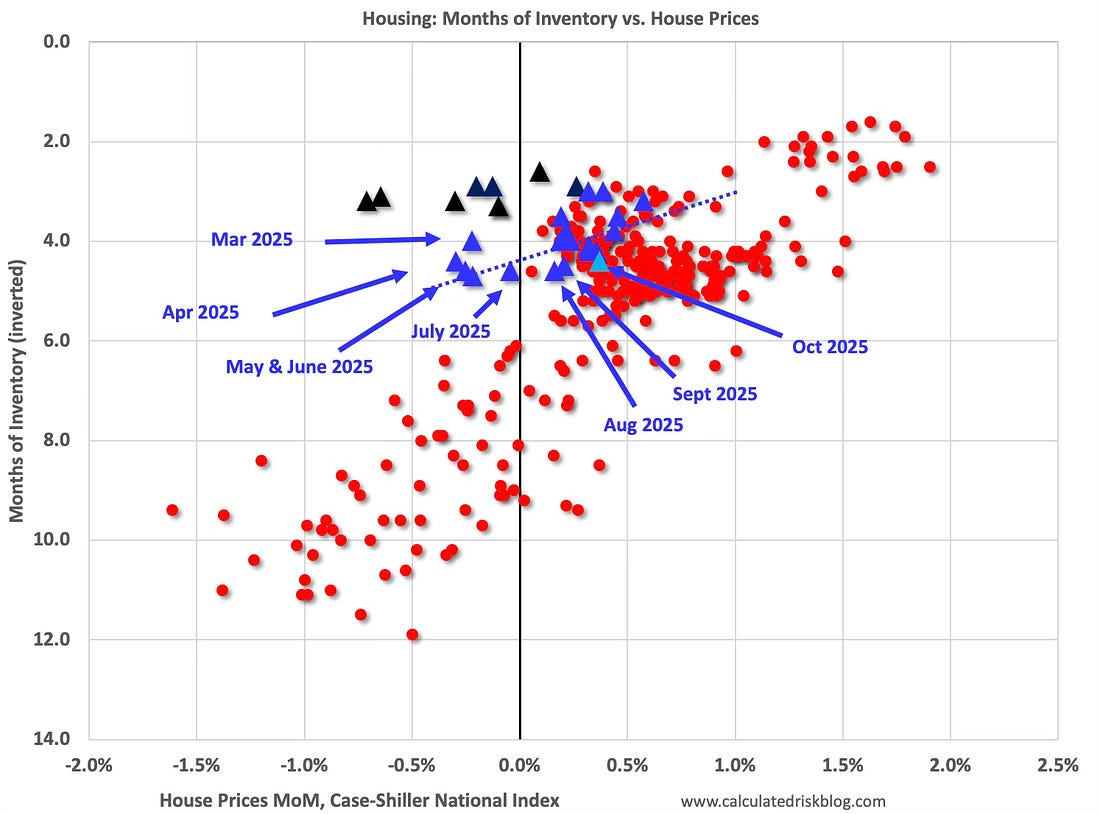
From June 2022 through February 2023, the months are in black showing that prices fell for seven months with low levels of inventory in 2022! The key reasons that prices fell in that period – even with low levels of inventory – was the rapid increase in mortgage rates (and monthly payments), and the mid-2022 surge in inventory. Some potential sellers quickly listed their homes, probably remembering what happened with house prices in the 2006 to 2011 period, but that inventory surge ended pretty quickly.
In October, the months-of-supply was at 4.4 months, and the Case-Shiller National Index (SA) increased 0.37% month-over-month. Historically prices haven’t declined until inventory reached 6 months of supply. However, the general trend over the last year (blue dashed line) suggested we are seeing national price declines with inventory less than 5 months of supply. This might have been because inventory was increasing fairly rapidly.
In the November existing home sales report, the NAR reported months-of-supply declined to 4.2 months NSA. Note that there are significant regional differences in both inventory and house prices.
Mortgage Rates
Here are the weekly 30-year mortgage rates according to the Freddie Mac PMMS since January 2020.
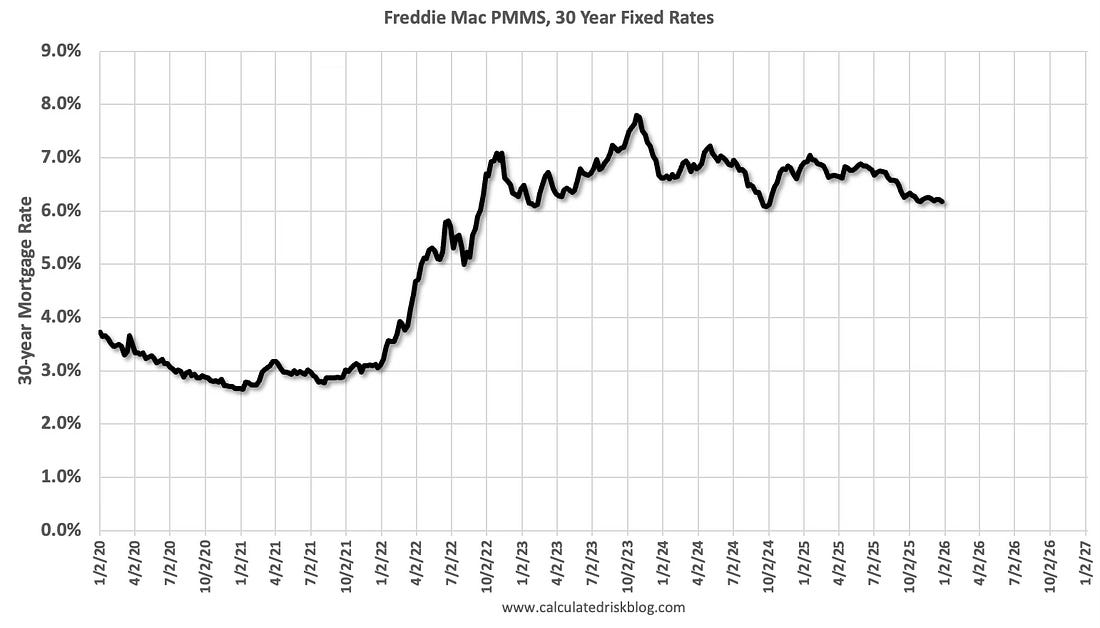
The October Case-Shiller report was mostly for contracts signed in the June through September period when 30-year mortgage rates average around 6.6%.
Rates have declined recently due to recent employment weakness. I’ve been saying for a few years that the 6% to 7% range for 30-year mortgages is the “new normal”. No one should expect rates to drop into the low 5% range (or lower) without a recession or another crisis.
Comparing to Median House Prices
Here is a comparison of year-over-year change in median house prices from the NAR and the year-over-year change in the Case-Shiller index. Median prices are distorted by the mix and repeat sales indexes like Case-Shiller and FHFA are probably better for measuring prices. However, in general, the Case-Shiller index follows the median price.
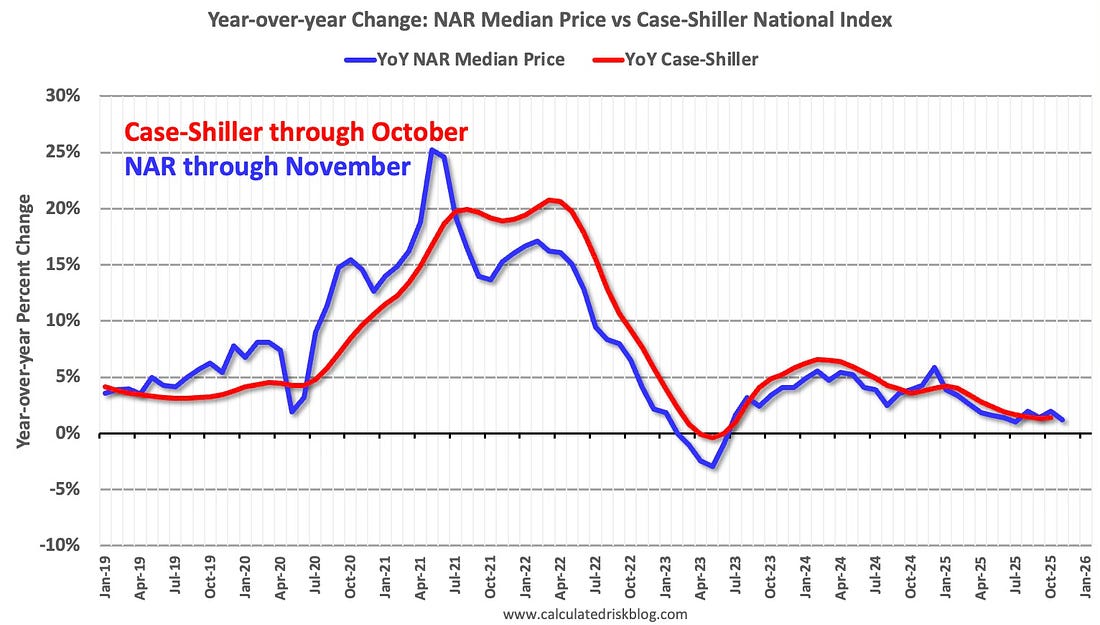
The median price was up 1.2% year-over-year in November, down from 2.0% YoY in October, andthe Case-Shiller National Index was up 1.4% year-over-year in the October report. This suggests the Case-Shiller index will likely be about the same year-over-year in the November report compared to October.
NOTE: The median price for November will likely be revised up.
Annual price changes were at expectations and will likely see a decline in the year-over-year change in the coming months.
Note that seasonally adjusted month-over-month Case-Shiller prices were relatively strong at the end of 2024 (averaging 0.49% per month for November 2024 through January 2025), so even if prices are up slightly month-over-month for the next few months, the year-over-year change will likely decline.
Inventory and months-of-supply will be the key metrics to watch for house prices.