FHFA House Prices up 4.8% YoY
CALCULATEDRISK
By Bill McBride
S&P/Case-Shiller released the monthly Home Price Indices for January (“January” is a 3-month average of November, December and January closing prices). January closing prices include some contracts signed in September, so there is a significant lag to this data. Here is a graph of the month-over-month (MoM) change in the Case-Shiller National Index Seasonally Adjusted (SA).
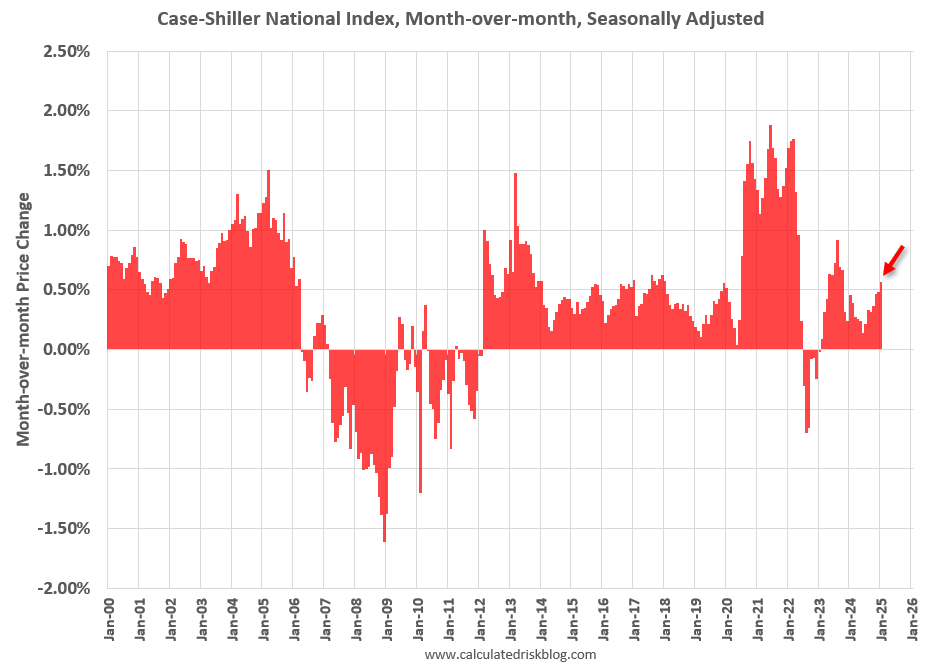
The MoM increase in the seasonally adjusted (SA) Case-Shiller National Index was at 0.57% (a 7.0% annual rate), This was the 24th consecutive MoM increase in the seasonally adjusted index.
On a seasonally adjusted basis, prices increased month-to-month in 19 of the 20 Case-Shiller cities (prices declined in Tampa seasonally adjusted). San Francisco has fallen 5.1% from the recent peak, Tampa is down 1.5% from the peak, and Denver down 0.7%.
FHFA House Price Index
On the FHFA index: FHFA House Price Index Up 0.2 Percent in January; Up 4.8 Percent from Last Year
U.S. house prices rose 0.2 percent in January, according to the U.S. Federal Housing (FHFA) seasonally adjusted monthly House Price Index (FHFA HPI®). House prices rose 4.8 percent from January 2024 to January 2025. The previously reported 0.4 percent price growth in December was revised upward to 0.5 percent.
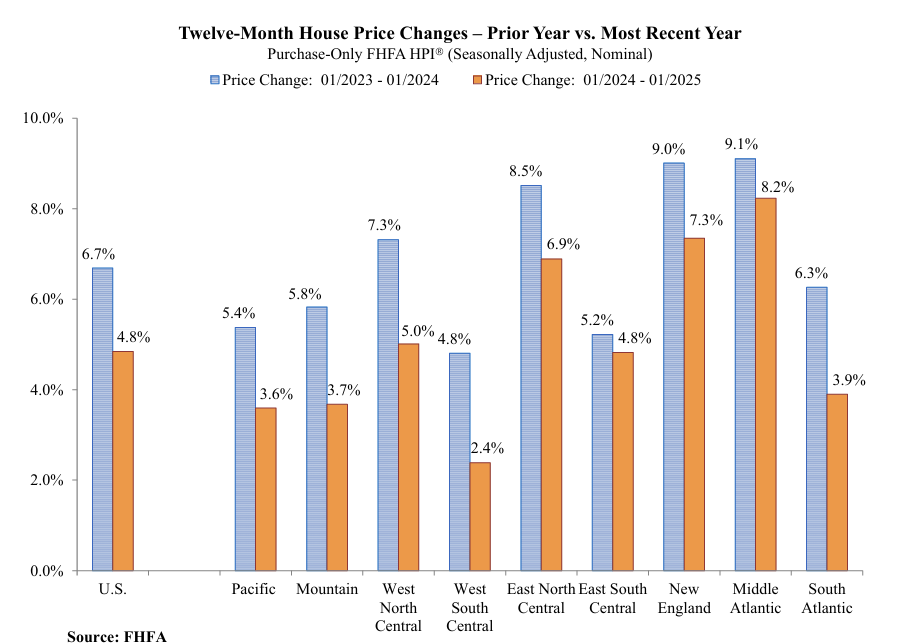
For the nine census divisions, seasonally adjusted monthly home price changes ranged from -0.8 percent in the South Atlantic division to +1.0 percent in the West North Central division. The 12-month changes were all positive, ranging from +2.4 percent in the West South Central division to +8.2 percent in the Middle Atlantic division.
emphasis added
Here is a graph from the FHFA report showing the annual change by region for January 2025 compared to January 2024. Prices have increased year-over-year in all regions. Note that the YoY increase is smaller this year, compared to the YoY increase in January 2024 in all of the nine regions.
Case-Shiller House Prices
From S&P S&P CoreLogic Case-Shiller Index Records 4.1% Annual Gain in January 2025
The S&P CoreLogic Case-Shiller U.S. National Home Price NSA Index, covering all nine U.S. census divisions, reported a 4.1% annual return for January, up from a 4% annual gain in the previous month. The 10-City Composite saw an annual increase of 5.3%, up from a 5.2% annual increase in the previous month. The 20-City Composite posted a year-over-year increase of 4.7%, up from a 4.5% increase in the previous month. New York again reported the highest annual gain among the 20 cities with a 7.7% increase in January, followed by Chicago and Boston with annual increases of 7.5% and 6.6%, respectively. Tampa posted the lowest return, falling 1.5%.
…
The pre-seasonally adjusted U.S. National and 20-City Composite Indices presented slight upward trends in January, with both posting 0.1% increases. The 10-City Composite posted a monthly return of 0.2%.
After seasonal adjustment, the 20-City and 10-City Composite Indices posted month-over-month increases of 0.5%. The U.S National posted a month-over-month increase of 0.6%.
“Home price growth continued to moderate in January, reflecting a clear two-part story across the past year,” says Nicholas Godec, CFA, CAIA, CIPM, Head of Fixed Income Tradables & Commodities at S&P Dow Jones Indices. “The National Composite Index posted a 4.1% annual gain, with the bulk of appreciation—4.8%—occurring in the first half of the year. Prices declined 0.7% in the second half, as high mortgage rates and affordability constraints weighed on buyer demand and market activity.
“Among the 20 metro areas tracked by the Composite 20, New York City led annual gains with a 7.7% rise, followed closely by Chicago (7.5%) and Boston (6.5%). Tampa was the only market to post a year over-year decline, falling 1.5%. However, the second half of the year told a different story: San Francisco posted the largest six-month decline at 3.4%, followed by Tampa at 3.2%. Only four of the 20 cities managed to eke out price increases during this period—New York, Chicago, Phoenix, and Boston—highlighting broad-based cooling.
“Rising mortgage rates throughout the year elevated monthly payment burdens, which, combined with already high home prices, pushed affordability to multi-decade lows in many regions. This likely contributed to subdued activity in the back half of the year, with both buyers and sellers exercising caution. Inventory constraints also remain a challenge, particularly in legacy metro areas, where limited new construction continues to restrict supply.
“The strength in markets like New York and Chicago may reflect more normalized valuations relative to frothier regions, along with continued urban recovery trends post-pandemic. On the other hand, Sunbelt markets that experienced sharp run-ups earlier in the cycle—like Tampa and Phoenix—have seen the most pronounced slowdowns.
emphasis added
This graph shows the nominal seasonally adjusted Composite 10, Composite 20 and National indices (the Composite 20 was started in January 2000).
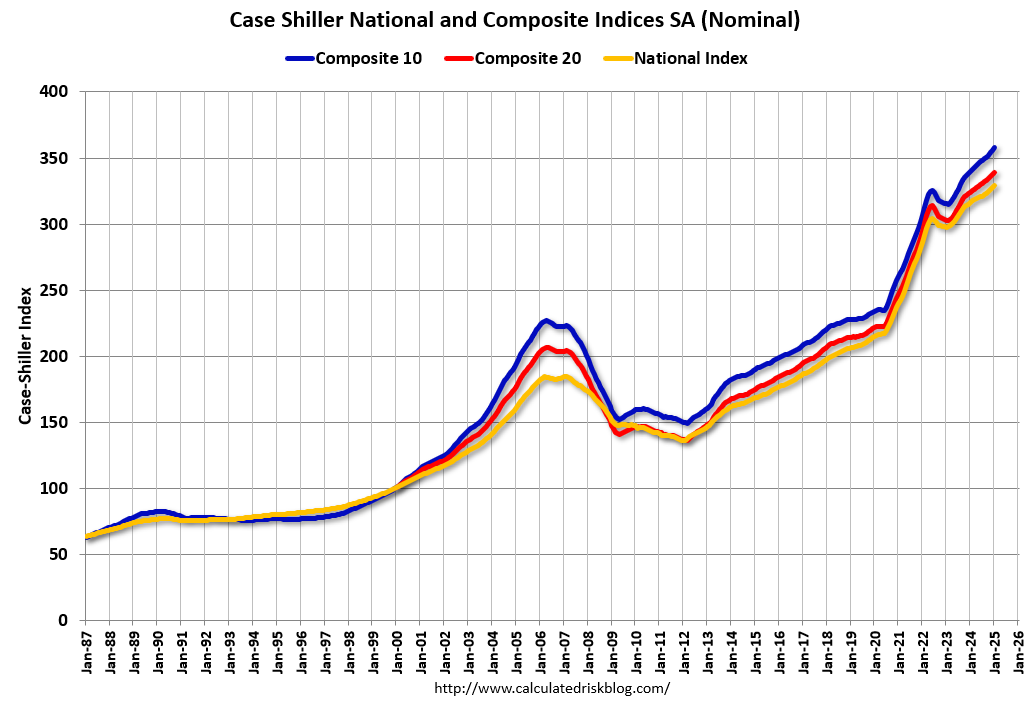
The Composite 10 index was up 0.5% in January (SA). The Composite 20 index was up 0.5% (SA) in January. The National index was up 0.6% (SA) in January.
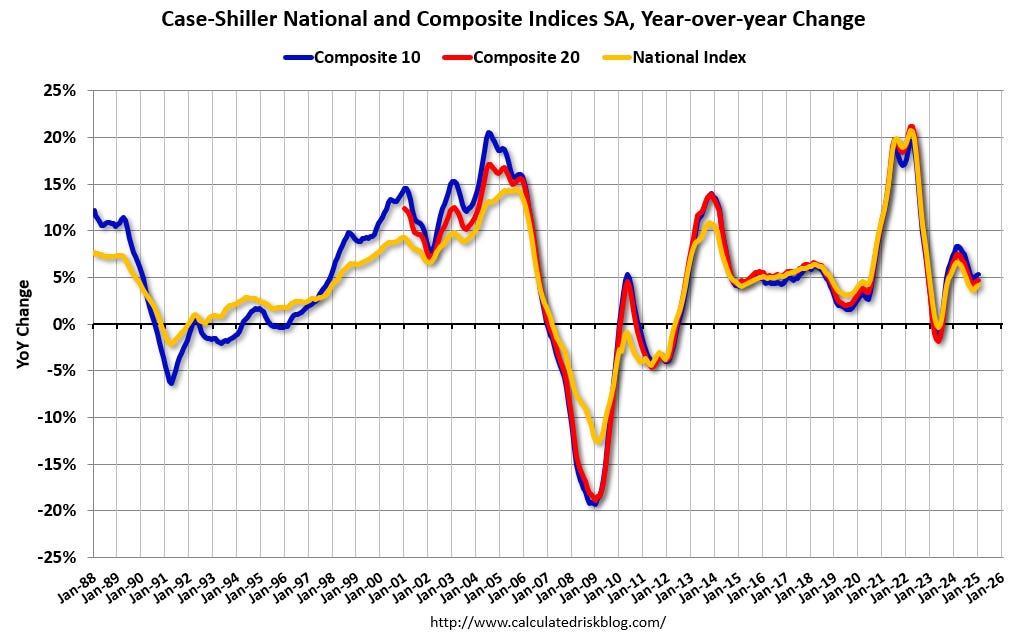
The Composite 10 NSA was up 5.3% year-over-year. The Composite 20 NSA was up 4.7% year-over-year. The National index NSA was up 4.1% year-over-year. Annual price changes were slightly higher than expectations.
And a few things to watch …
House Prices and Inventory
This graph below shows existing home months-of-supply, inverted, from the National Association of Realtors® (NAR) vs. the seasonally adjusted month-to-month price change in the Case-Shiller National Index (both since January 1999 through January 2025). Note that the months-of-supply is not seasonally adjusted.
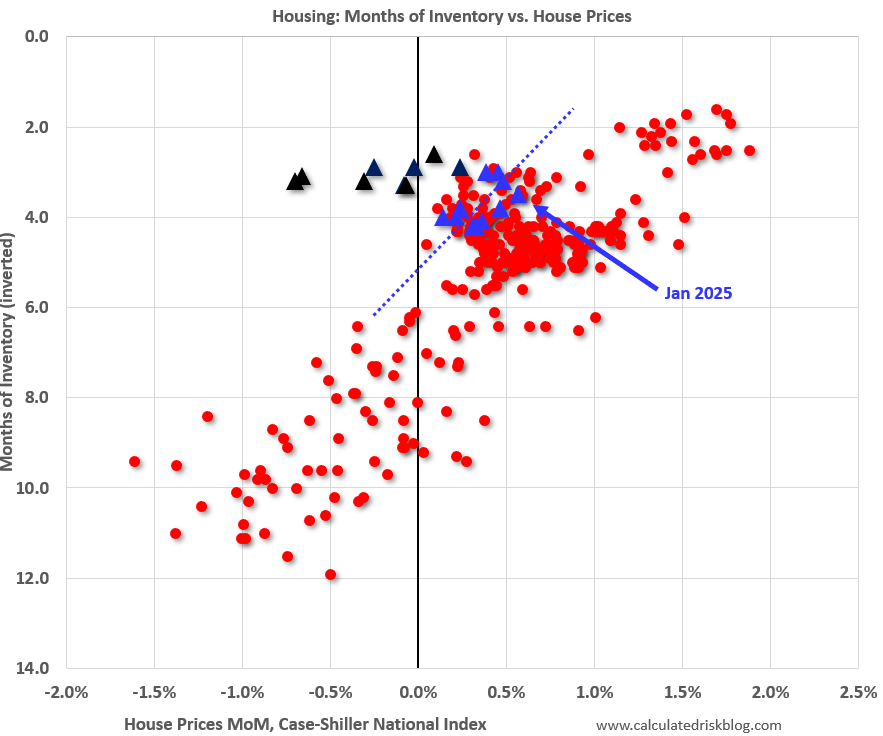
From June 2022 through February 2023, the months are in black showing that prices fell for seven months with low levels of inventory in 2022! The key reasons that prices fell in that period – even with low levels of inventory – was the rapid increase in mortgage rates (and monthly payments), and the mid-2022 surge in inventory. Some potential sellers quickly listed their homes, probably remembering what happened with house prices in the 2006 to 2011 period, but that inventory surge ended pretty quickly.
In January, the months-of-supply was at 3.5 months, and the Case-Shiller National Index (SA) increased 0.57% month-over-month. Historically prices haven’t declined until inventory reached 6 months of supply. However, the general trend over the last year (blue dashed line) suggests we might see national price declines if inventory reach over 5 1/2 months of supply.
In the February existing home sales report, the NAR reported months-of-supply was unchanged at 3.5 months. It is possible months-of-supply will reach 5.0+ months in 2025. Year-over-year price growth will likely slow as months-of-supply increases in 2025.
Mortgage Rates
Here are the weekly 30-year mortgage rates according to the Freddie Mac PMMS since January 2020.
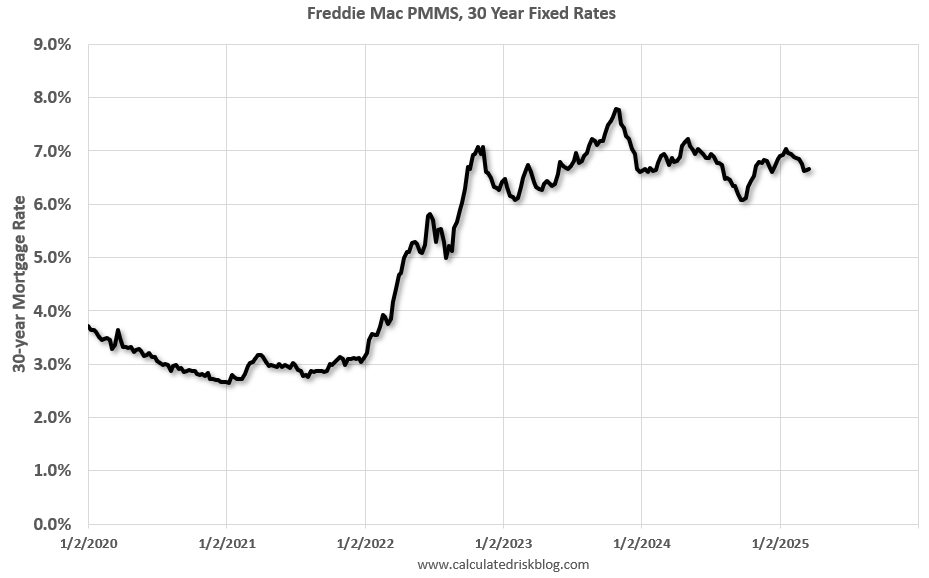
The January Case-Shiller report was mostly for contracts signed in the September through December period when 30-year mortgage rates average around 6.5%.
The dip in rate in mortgage rates in the August through September period, probably provided some boost to prices in the January Case-Shiller report. However, 30-year mortgage rates are around 6.8% again, and that will likely slow price gains.
Comparing to Median House Prices
Here is a comparison of year-over-year change in median house prices from the NAR and the year-over-year change in the Case-Shiller index. Median prices are distorted by the mix and repeat sales indexes like Case-Shiller and FHFA are probably better for measuring prices. However, in general, the Case-Shiller index follows the median price.
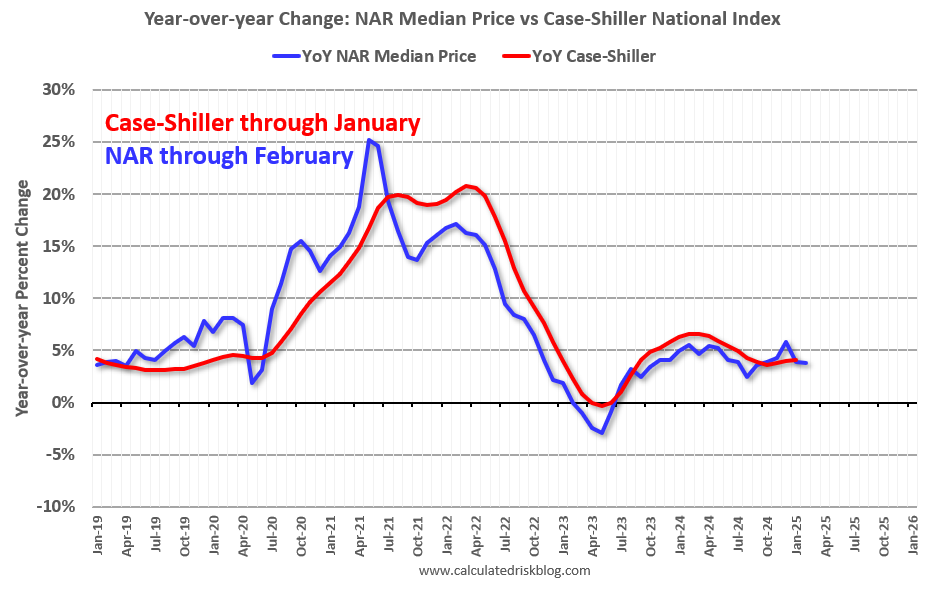
The median price was up 3.8% year-over-year in February, down from 3.9% YoY in January, andthe Case-Shiller National Index was up 4.1% year-over-year in the January report. This suggests the Case-Shiller index might be up a little lower year-over-year in the February report compared to January.
Last year, in February 2024, the Case-Shiller index was up 0.39% MoM, so the YoY change will likely be about the same or lower in the February report (probably around 4.0% YoY) and start to slow in the following 2025 reports.
Inventory and months-of-supply will be the key metrics to watch for house prices.