Calculated Risk
A Sharp Decline in Sales, House Prices and Rents Falling, but a Smaller Decline in New Listings
by Bill McBride
New Listings at Record Low
Here is a graph of new listing from Realtor.com’s January Housing Trends Report showing new listings were down about 5% year-over-year in January. Although new listings are at a record low for January, the year-over-year decline was smaller in January than in Q4 2022. From Realtor.com:
In January, the number of homes newly-listed for sale declined by 5.4% compared to the same time last year. This is a much lower rate of decline than last month’s 21.0% decrease and November’s 17.2% decrease. However, new listings remain 25.0% below pre-pandemic 2017 to 2019 levels.

And the local markets I track that have reported so far, show new listings were down less in January than in December.
For these areas, new listings were down 9.2% YoY. … Last month, new listings in these markets were down 21.7% YoY. This is a significantly smaller YoY decline in new listings, and something to watch.
Impact on Active Inventory
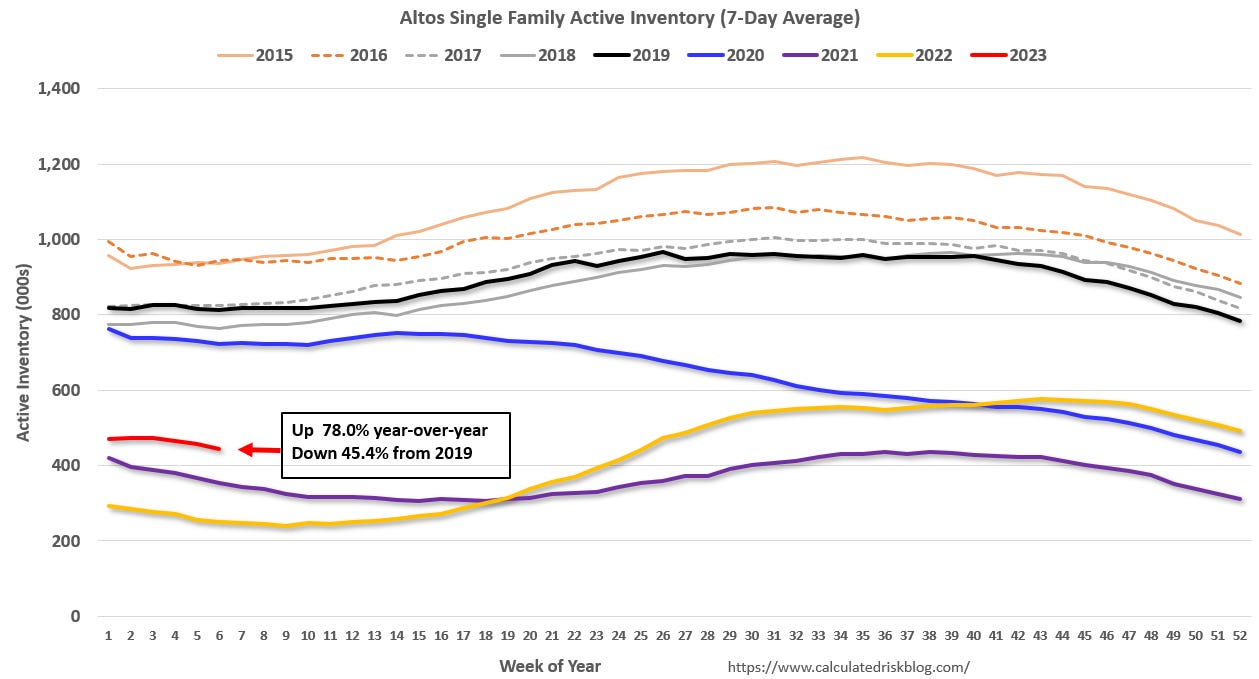
The following graph shows the seasonal pattern for active single-family inventory since 2015. The red line is for 2023. The black line is for 2019.
Single-family active existing home inventory was up 78.0% compared to the same week in 2022, and down 45.4% compared to the first week in 2019. Inventory is still historically low. A key will be when inventory starts increasing in 2023 – so far inventory has declined about 9.7% over the first six weeks of 2023.
For new homes, there are 5.5 months of homes under construction (blue line below) – well above the normal level. This elevated level of homes under construction is due to supply chain constraints. There are 1.4 months of completed homes for sale (red). This is close to the normal level.
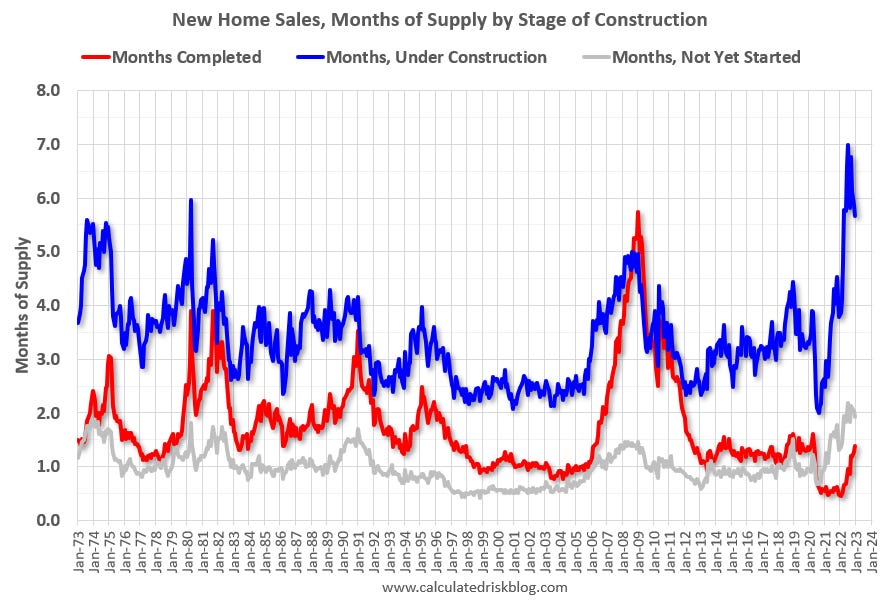
It is likely we will see a sharp increase in completed inventory over the next several months – and that will put pressure on new home prices. Note: Due to the increase in cancellations, the Census Bureau is probably overstating sales, and understating inventory – especially completed inventory.
And for housing starts there are a record 1.71 million units under construction.
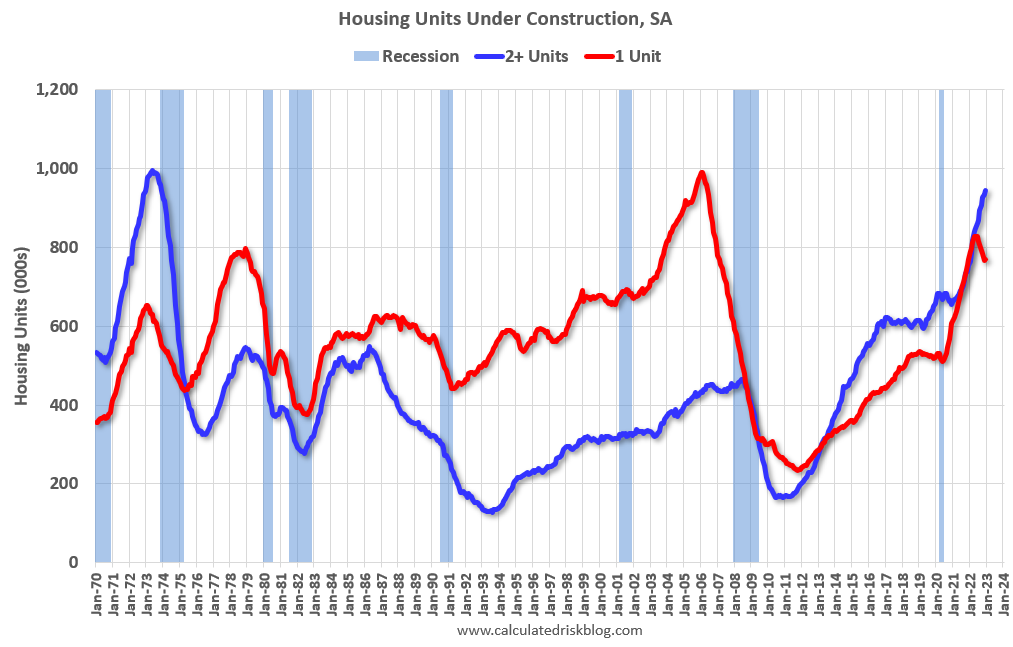
Red is single family units. Currently there are 769 thousand single family units (red) under construction (SA). This is 59 thousand below the recent peak in April and May. Single family units under construction have peaked since single family starts are now declining. Blue is for 2+ units. Currently there are 943 thousand multi-family units under construction. This is the highest level since December 1973!
30-Year Mortgage Rates Declined from October Highs
The following graph from MortgageNewsDaily.com shows mortgage rates over the last 3 years. 30-year mortgage rates were at 6.54% on February 13th, down from over 7% for most of October – but still up sharply year-over-year.
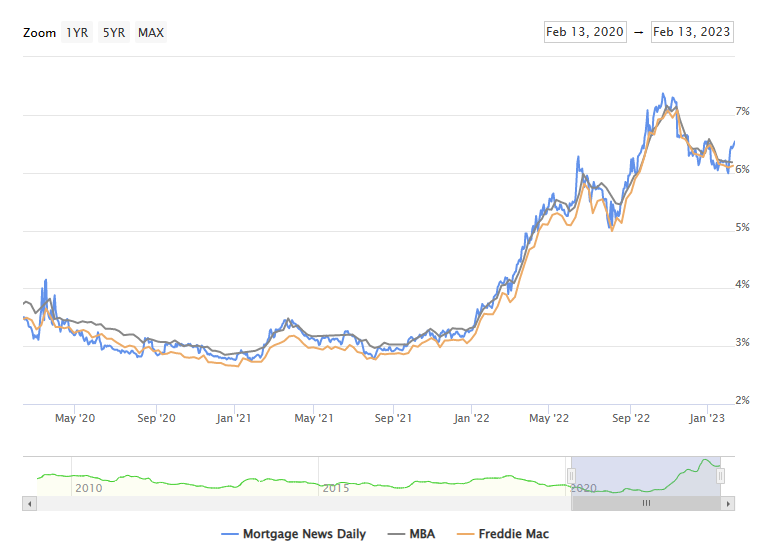
A year ago, the payment on a $500,000 house, with a 20% down payment and 4.0% 30-year mortgage rates, would be around $1,909 for principal and interest. The monthly payment for the same house, with house prices up 6% YoY and mortgage rates at 6.54%, would be $2,691 – an increase of 41%! Even though mortgage rates have declined recently, monthly payments are still up sharply year-over-year.
There are always some people that need to sell; death, divorce, moving for employment are a few reasons. However, homeowners with a low mortgage rate will be reluctant to sell, and then buy a new home, when their monthly payment will be much higher for the new home. The sharp increase in mortgage rates is probably the key reason new listings have declined sharply year-over-year.
This is very different from the housing bust, when many homeowners were forced to sell as their teaser rates expired and they could not afford the fully amortized mortgage payment. The current situation is similar to the 1980 period, when rates increased quickly.
House Prices
Reported YoY house price growth is still positive, but the Case-Shiller National Index slowed to 7.7% YoY in November.
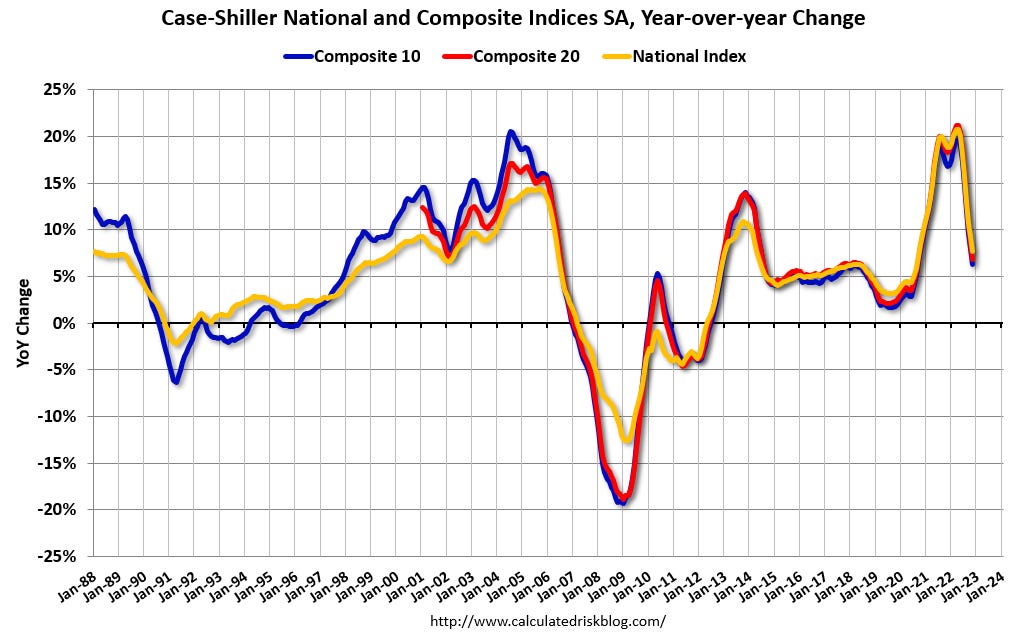
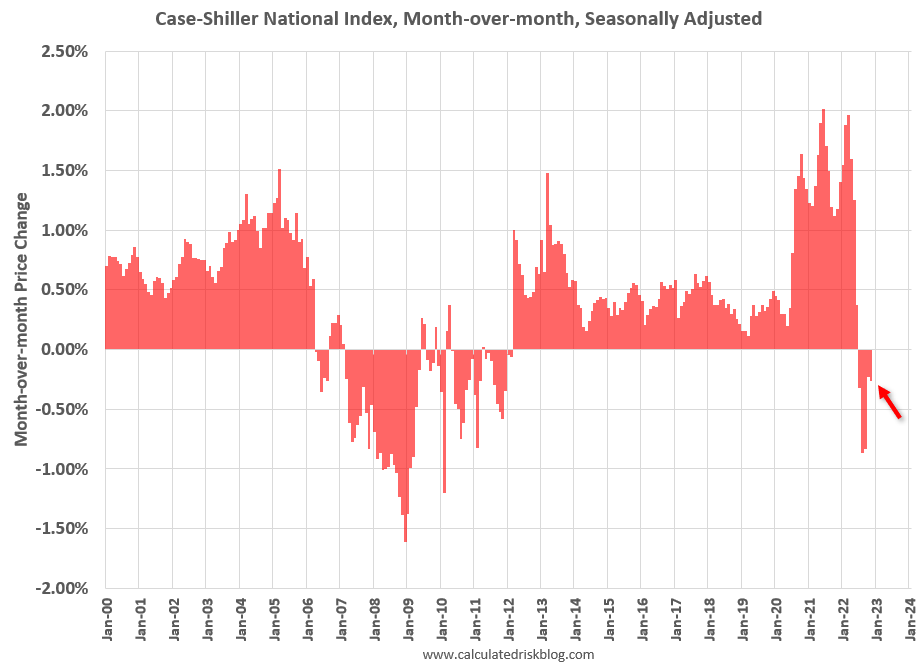
The MoM decrease in the Case-Shiller National Index was at -0.26% seasonally adjusted. This was the fifth consecutive MoM decrease, and a slightly larger decrease than in October.
Other measures of house prices indicated further declines in December. The NAR reported median prices were up only 2.3% YoY in December. Black Knight reported prices were up 5.0% YoY, and Freddie Mac reported house prices were up 4.1% YoY in December.
It is likely house prices will be down YoY soon, and I’m now forecasting a 10%+ decline in nominal house prices, see House Prices: 7 Years in Purgatory.
Sales
We have seen declines in both new and existing home sales due to higher mortgage rates. The NAR reported sales in December were at a “seasonally adjusted annual rate of 4.02 million in December. Year-over-year, sales sagged 34.0% (down from 6.09 million in December 2021).”
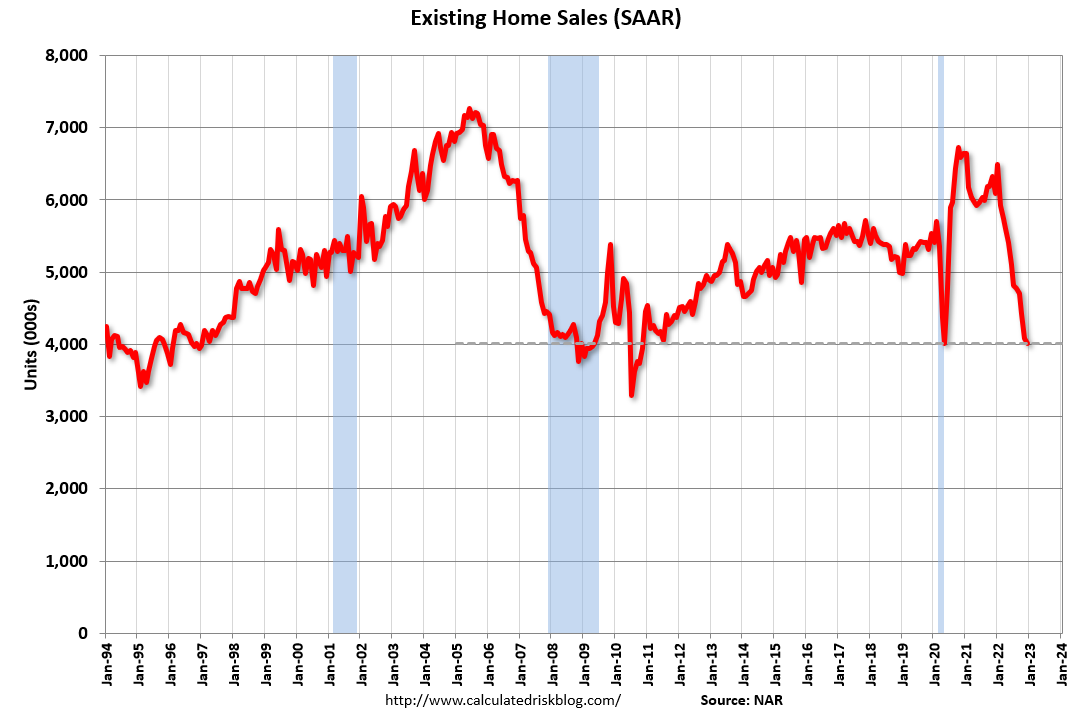
The early local market reports suggest a smaller year-over-year decline in closed sales in January. It is possible that existing home sales, seasonally adjusted, bottomed in December. But a bottom in existing home sales doesn’t mean other measures are near a bottom. There are usually two bottoms for housing.
[T]here will be two bottoms for housing: one for activity and the other for prices. Existing home sales may have already bottomed, but we will see further declines in residential investment. Prices – especially in real terms – will be under pressure for some time.
And the Census Bureau reported “Sales of new single‐family houses in December 2022 were at a seasonally adjusted annual rate of 616,000”, down 26.6% from December 2021.

It is important to note that the Census Bureau reports gross sales, whereas the homebuilders report net sales (gross sales minus cancellations). Usually this isn’t a big difference, but during periods of rising cancellations, reported sales are too high, and inventory is too low.
Rents Continue to Decline
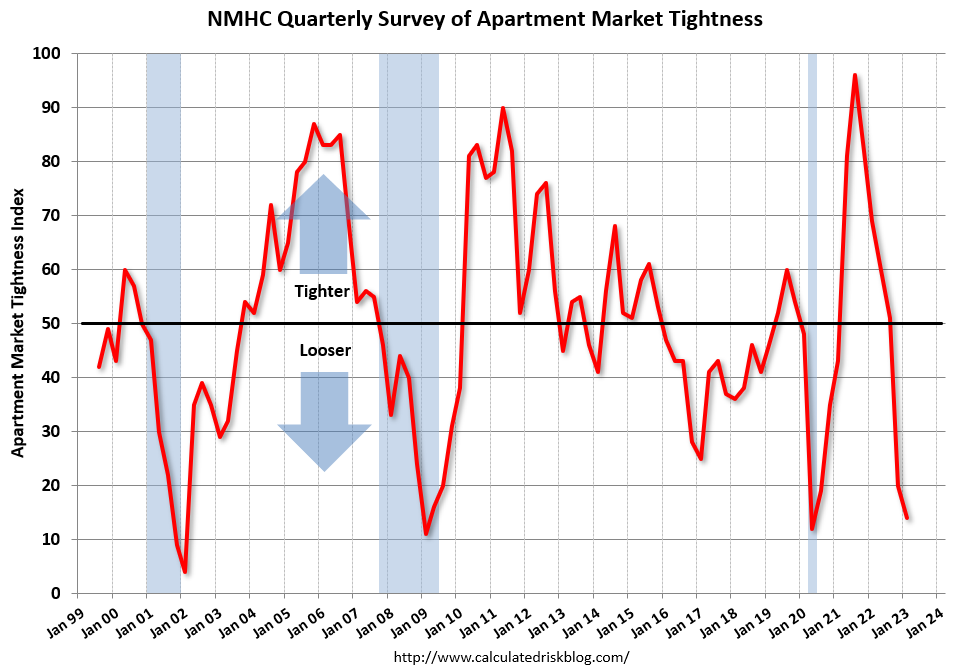
Rents are declining, and as the pace of household formation slows, and more supply comes on the market we will likely see further rent declines. An excellent leading indicator for rents and vacancy rates is the National Multifamily Housing Council (NMHC) quarterly survey, and this suggests higher vacancy rates and falling asking rents in the coming months.
The Market Tightness Index came in at 14 this quarter—well below the breakeven level (50)—indicating looser market conditions for the second consecutive quarter.
Conclusions
We have seen a significant year-over-year decline in the housing market with fewer sales and more new home cancellations. We are just starting to see the impact on house prices.
New listings are at a record low, but the YoY decline was smaller in January than the preceding months.
Existing home sales will rebound a little in January but will still be a low level. Housing starts will probably show further declines (and still a near record number of homes under construction).