CALCULATEDRISK
By Bill McBride
This 2-part overview for mid-July provides a snapshot of the current housing market.
The key stories for existing homes are that inventory is increasing sharply, and sales are essentially flat compared to last year (and sales in 2024 were the lowest since 1995). That means prices are under pressure (although there will not be a huge wave of distressed sales).
And it has been a disappointing year for new homebuilders (but not horrible). Homebuilders have a growing number of completed homes for sales, a larger than normal number of unsold homes under construction and are reducing prices to compete with more existing home inventory. From the NAHB:
[T]he latest HMI survey also revealed that 37% of builders reported cutting prices in June, the highest percentage since NAHB began tracking this figure on a monthly basis in 2022. This compares with 34% of builders who reported cutting prices in May and 29% in April. Meanwhile, the average price reduction was 5% in June, the same as it’s been every month since last November. The use of sales incentives was 62% in June, up one percentage point from May.
“Rising inventory levels and prospective home buyers who are on hold waiting for affordability conditions to improve are resulting in weakening price growth in most markets and generating price declines for resales in a growing number of markets,” said NAHB Chief Economist Robert Dietz. “Given current market conditions, NAHB is forecasting a decline in single-family starts for 2025.”
Active Listings for Existing Homes Up Sharply Year-over-year
Realtor.com reports in the June 2025 Monthly Housing Market Trends Report that new listings were up 6.2% year-over-year in June. And active listings were up 28.9% year-over-year.
Homebuyers found more options in June, as the number of actively listed homes rose 28.9% compared to the same time last year. This builds on May’s 30.1% increase and marks the 20th consecutive month of year-over-year inventory gains. The number of homes for sale topped 1 million (1.08 million) for the second consecutive month and exceeded 2020 levels for the third month in a row, a key pandemic recovery benchmark. Still, June inventory remains 12.9% below typical 2017–19 levels, down from 14.4% in May, indicating the market is closing the pre-pandemic inventory gap at an accelerating pace.

Note the seasonality for active listings. It now appears inventory will be back to 2019 levels by the end of 2025 even though sales are still be depressed – pushing up months-of-supply.
Here is some more data on supply and sales.
The following graph shows the seasonal pattern for active single-family inventory since 2015 through July 4, 2025, from Altos Research. The red line is for 2025. The black line is for 2019.
Inventory was up 30.8% compared to the same week in 2024, and only down 10.0% compared to the same week in 2019. This is the highest inventory level since November 2019.

Months-of-Supply
Since inventory has increased sharply and sales have been flat, a key for house prices is to watch months-of-supply. The following graph shows months-of-supply since 2017 using data from the NAR. Note that months-of-supply is higher than the previous 8 years!
Months-of-supply was at 4.6 months in May compared to 4.3 months in May 2019. National months-of-supply is now above pre-pandemic levels and will likely be above 5.0 months later this year (putting some pressure on prices).
The only month with this much supply, since July 2016, was in May 2020 (with the pandemic impacting sales).

Inventory would probably have to increase to 5 1/2 to 6 months of supply to see national price declines.
In 2022, we saw some price declines at the National level even with fairly low months-of-supply – probably due to the sharp increase in inventory and some sellers panicking while remembering the housing bust!
There are significant regional differences in months-of-supply. Here is a table of the local markets I follow for May 2025.
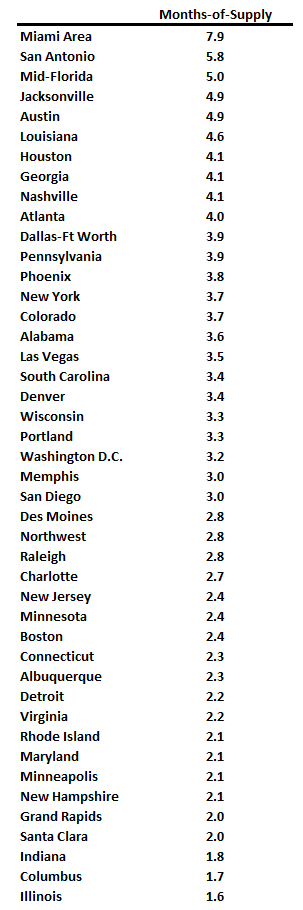
Cities with more than 6 months of supply this summer will likely see price declines. There is nothing magical about 6 months; some areas see price declines with less inventory, some more.
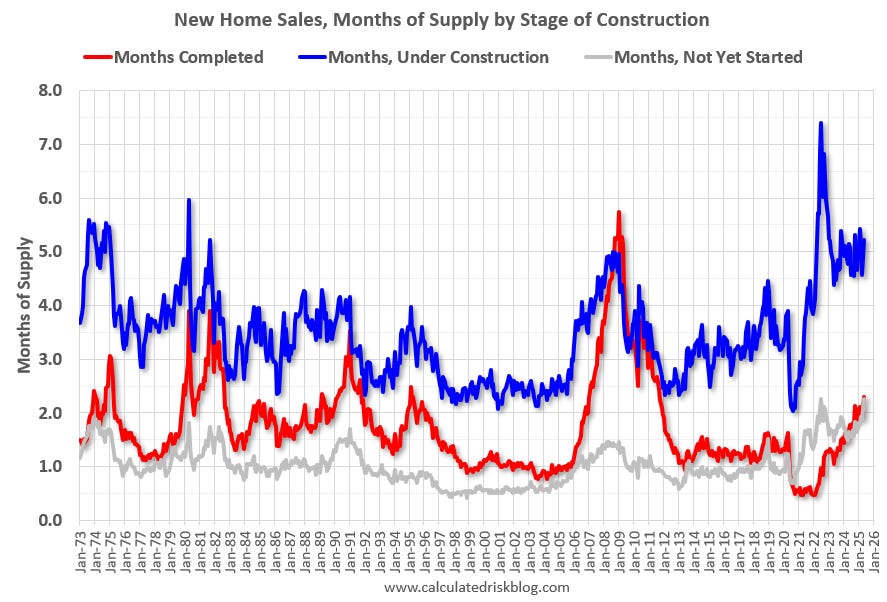
Over 5 Months of New Home Unsold Inventory Under Construction
For new homes, there are over 5 months of homes are under construction (see blue line below), well above the normal levels.
There are 2.3 months of completed supply (red line). This is also above the normal level.
New home inventory, as a percentage of total inventory, is still very high. The following graph uses Not Seasonally Adjusted (NSA) existing home inventory from the National Association of Realtors® (NAR) and new home inventory from the Census Bureau (only completed and under construction inventory).

It took a number of years following the housing bust for new home inventory to return to the pre-bubble percent of total inventory. Then, with the pandemic, existing home inventory collapsed and now the percent of new homes is 20.2% of the total for sale inventory, down from 22.8% a year ago in May 2024, and down from a peak of 27.2% in December 2022.
The percent of new homes of total inventory should continue to decline as existing home inventory increases.
And for housing starts there are still an above normal number of multi-family housing units under construction, and 1.377 million total units under construction.
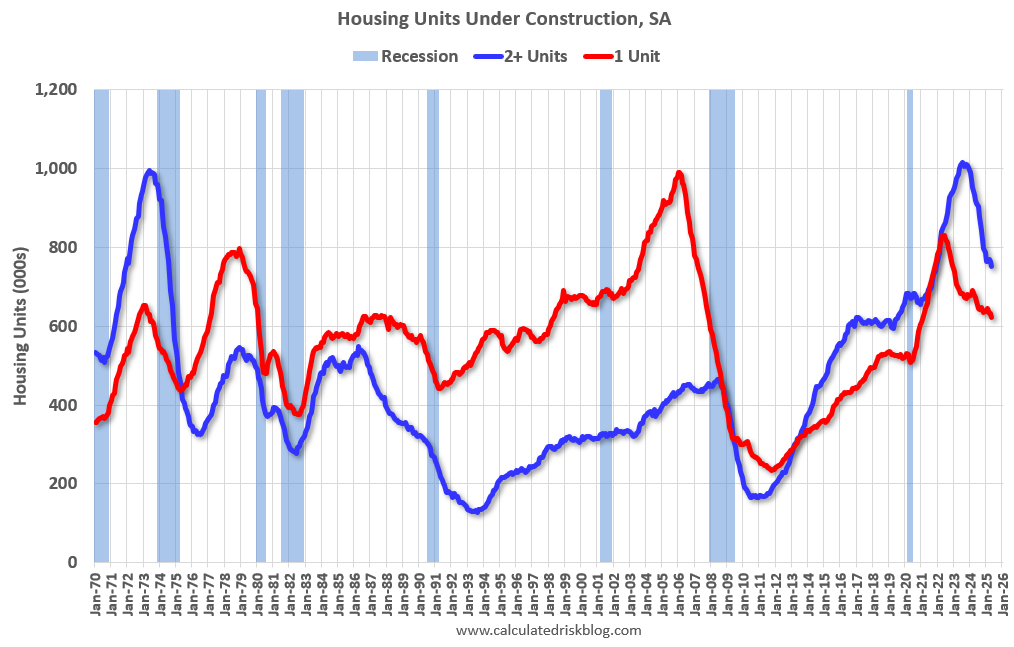
Currently there are 623 thousand single family units (red) under construction (SA) and 752 thousand multi-family units (blue) under construction.
Combined, there are 1.375 million units under construction, 340 thousand below the all-time record of 1.715 million set in October 2022.
In the three years prior to the pandemic, there were about 1.1 to 1.2 million housing units under construction – so the current level is still historically high.
Sales
The NAR reported sales were at a “seasonally adjusted annual rate of 4.03 million” in May.
As expected, existing home sales were down year-over-year for the 4th consecutive month. Sales have been mostly flat at close to 4 million SAAR for the last 2 1/2 years. This is running at the lowest level since 1995 on an annual basis.

And for new home sales, the Census Bureau reported “Sales of new single-family houses in May 2025 were at a seasonally-adjusted annual rate of 623,000”, down 6.3% YoY from May 2024.
New home sales have bounced around mostly between 600 and 700 thousand for the last three years. This is well above the housing bust years.

Whenever I talk about housing, the first question is always “What will happen with house prices?” And I always start my answer discussing inventory.
Inventory will tell the tale.
In Part 2, I’ll review house prices, rents, mortgage rates, and more.