CALCULATEDRISK
By Bill McBride
From housing economist Tom Lawler:
For the second consecutive year 2023 saw high levels of volatility in the US fixed-income markets in general and the mortgage/MBS markets in particular. Unlike in 2022, however, key Treasury rates and mortgage/MBS yields ended 2023 close to where they began.
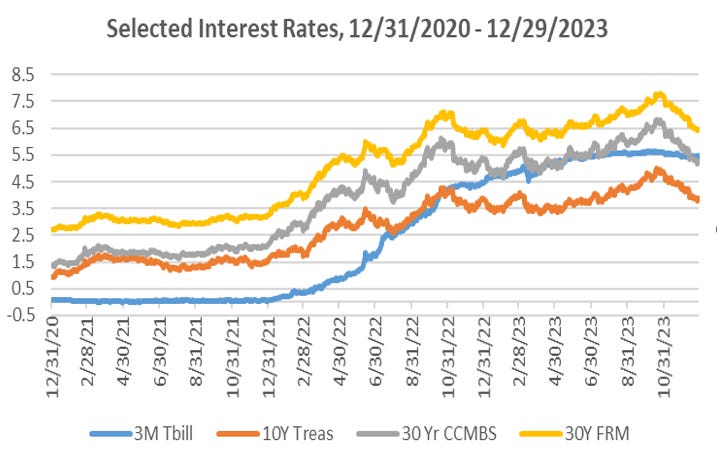
30-Yr CCMBS: Yield on “notional par” MBS derived from price for coupon closest to but below par and price for coupon closest to but above par.
30-Yr FRM: Optimal Blue 30-year index for borrowers with LTV<=80 and FICO>740.
As with 2022, 2023 saw much more volatility in mortgage rates and MBS yields than in Treasury rates, reflecting (1) large swings in market-implied interest rate volatility; (2) large moves in investor “appetite” for MBS as measured by widely-followed MBS option-adjusted spreads; and (3) significant swings in the yield curve.
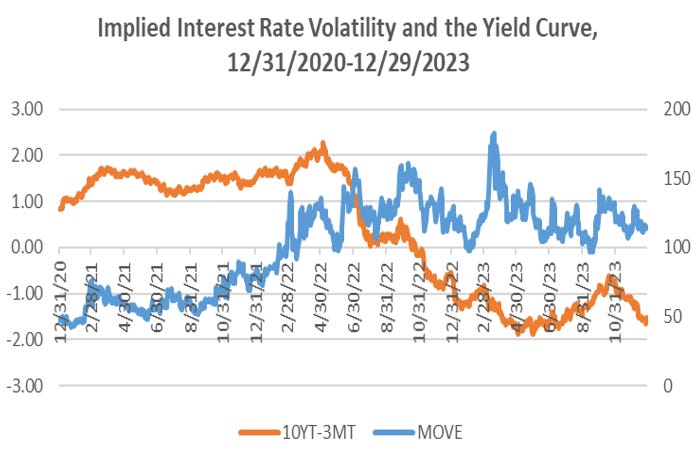
MOVE Index: Implied bp volatility from one-month options on Treasuries across the yield curve

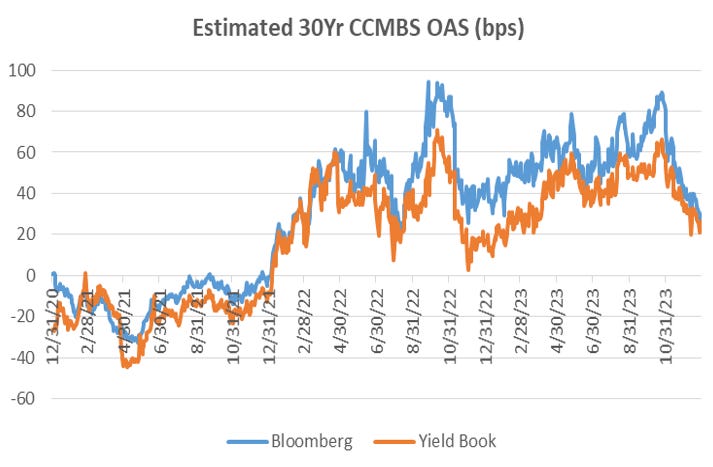
Note: by the end of last year both the Bloomberg and the Yield Book estimates of the CCMBS OAS were below their historical averages excluding periods of significant Federal Reserve intervention in the MBS.
Much of the “angst” in the MBS market over the last year and a half (aside from high interest rate volatility) was associated with “extension risk” – that is, the slowdown in MBS prepayments when interest rates increase. The sharp increase in mortgage rates following the uber-low rates of the previous few years resulted in a huge number of mortgages with rates well over 300 basis points below current market rates. That had not been seen in over 40 years, and most prepayment models had little or no data on how slow mortgage prepayments could get. In turned out that the answer was “really low” and lower than many models projected, meaning that MBS backed by these low-rate mortgages saw their duration extend by much more than many MBS investors had expected, leading to much larger than “expected” mark-to-market losses.
This “angst” may have been behind the surprisingly tight correlation between CCMBS OAS and yield levels in the second half off last year.
It should be noted, of course, that there are many market entities/analysts/practitioners that generate estimates of MBS OAS, and these various estimates can sometimes differ significantly (note, e.g., the differences between Bloomberg and Yield Book OAS estimates in the chart on the previous page). These differences can arise from different interest rate generation models, different market volatility calibration models, different mortgage rate models, and (of course) different prepayment models.
30-year fixed-rate mortgages pretty much tracked MBS yields last year, which is not surprising since a large share of mortgage originations are bundled into MBS. 30-year mortgage spreads to 10-year Treasuries, in contrast, were again historically high and volatile, which is not even remotely surprising given the high level of interest rate volatility, the inverted yield curve during most of the year, and the wide swings in MBS OAS.
As I’ve written about many times before, 30-year fixed-rate mortgages and 30-year MBS bear little resemblance to a 10-year Treasury: the timing of expected cash flows is massively different, and while the timing of cash flows from a 10-year Treasury is known with certainty, the timing of cash flows from MBS is highly uncertain because borrowers can prepay their mortgage in whole or in part at any time without penalty. The timing of mortgage/MBS cash flows is very much dependent on the future path of interest rates (as well as many other factors), and the “fair” value of MBS is highly dependent both on “base” expectation of future interest rates as well as market-implied potential volatility of future interest rates.
As such, there really is no such thing as a “normal” spread between mortgage rates and 10-year Treasury rates, except perhaps in the context of an environment when the yield curve shape is “normal,” interest rate volatility is “normal,” and investors’ “appetite” for taking the interest rate risk associated with mortgages/MBS is “normal.” But as a rule mortgage spreads to 10-year Treasuries are (1) negatively correlated to the yield curve (or the spread between long-term and short-term rates); (2) positively correlated to market implied interest rate volatility; and (3) positively correlated to option-adjusted MBS spreads.
To give one an example of how volatility and the yield curve can impact CCMBS/10-Year Treasury spreads, here are a few dates where both the Bloomberg and the Yield Book estimated current coupon MBS OAS were about the same, yet implied interest rate volatilities and Treasury yield curves were dramatically different.

While on each of these dates the Bloomberg CCMBS OAS were about the same, as were the Yield Book CCMBS OAS, the CCMBS/10 Year Treasury spread ranged from 70 bp to 138 bp. Not surprisingly, on the date when the CCMBS/10-Year Treasury spread was narrow market implied interest rate volatility was very low, and the yield curve was relatively steep. And on the day that the CCMBS/10-Year Treasury spread was “high,” market implied interest rate volatility was high and the yield curve was significantly inverted.
If one believed that the CCMBS OAS on these dates were “normal” (they actually were on the low side relative to history excluding periods of Federal Reserve intervention in the MBS market), then prevailing market conditions indicated that on 12/29/2023 a CCMBS/10-Year Treasury spread of 138 bp was “normal,” while on 5/18/2018 prevailing market conditions indicated that a CCMBS/10-Year Treasury spread of 78 bp was “normal.”
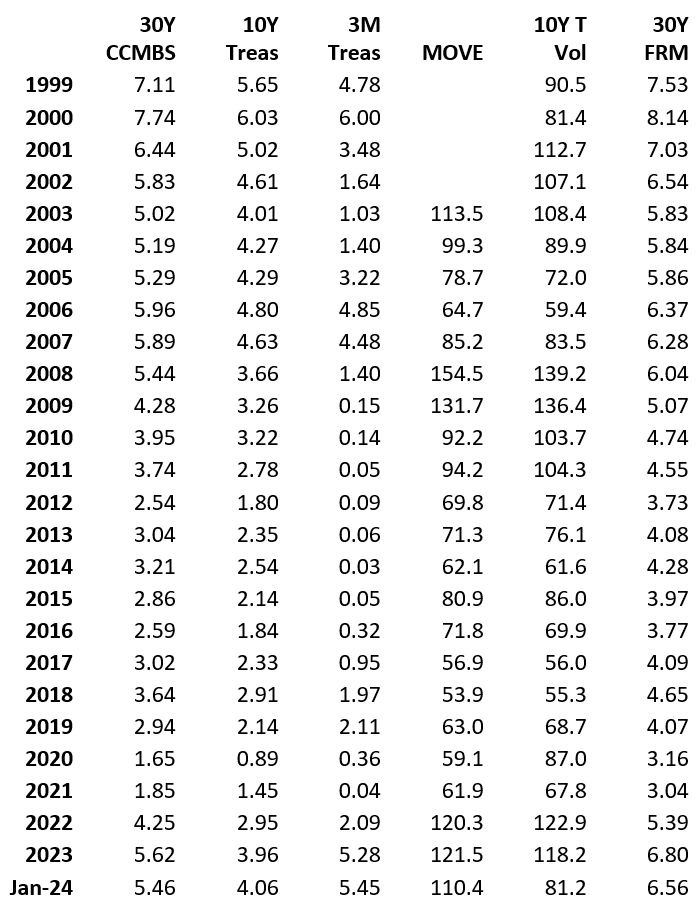
Below is a table showing yearly average rates from 1999 through 2023 as well as monthly averages for January 2024. Also show are yearly averages for the MOVE Index as well as annualized bp volatility for the 10-year Treasury based on daily closes. (Note: the MOVE Index actually goes back into the 90’s, but I only have data back to November 12, 2002.) For the 30-year FRM, from 2005 to 2023 I use the Freddie Mac rate based on its new methodology (started in the latter part of 2022). For 2002 to 2005 I use the old Freddie Mac survey data, while for 1999 to 2001 I adjust the old Freddie survey data for the higher level of fees/points charged relative to subsequent years. For January 2024 I use the average Optimal Blue 30-year index for borrowers with an LTV<=80 and a FICO score >740, which is available daily.
This next table shows some key annual average spreads.
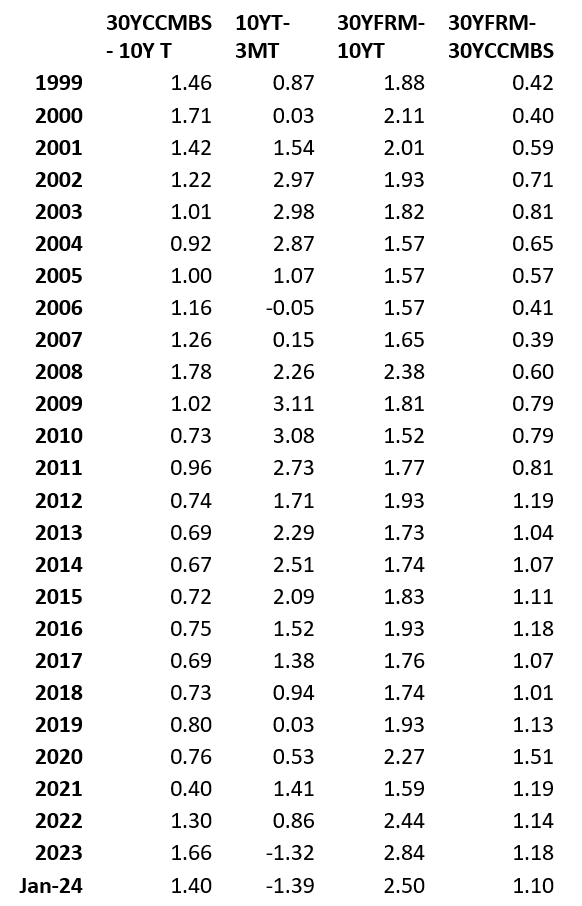
Note that the “primary/secondary” mortgage spread has been significantly wider over the last decade than was the case during most of the 2000’s. As I’ve written about before, that wider spread reflects (1) significantly higher GSE guarantee fees, and (2) somewhat higher origination/servicing costs associated with regulatory changes that followed the financial/mortgage market crisis.
The current primary/secondary spread is also impacted by MBS “price compression” – that is, a relatively narrow price spread between MBS at around par and the next higher MBS coupon – that is partly the result of the steeply inverted yield curve. Many lenders recoup origination costs by charging a higher interest rate and selling MBS at a premium, but in today’s market originators must “charge” about 40 bp more in rate for each one percent of MBS premium. In a more “normal” environment when the yield curve is upward sloping and interest rate volatility is “subdued,” that “tradeoff” has been more like 25-30 bp.
E.g., below is a table showing the “notional par” MBS coupon (derived from the coupon just below par and the coupon just above par) with the “notional” MBS coupon for a 101 price (derived from the coupon just below 101 and the coupon just above 101). Also shown is the Optimal Blue 30-Year FRM for borrowers with LTV<=80% and FICO score >740.
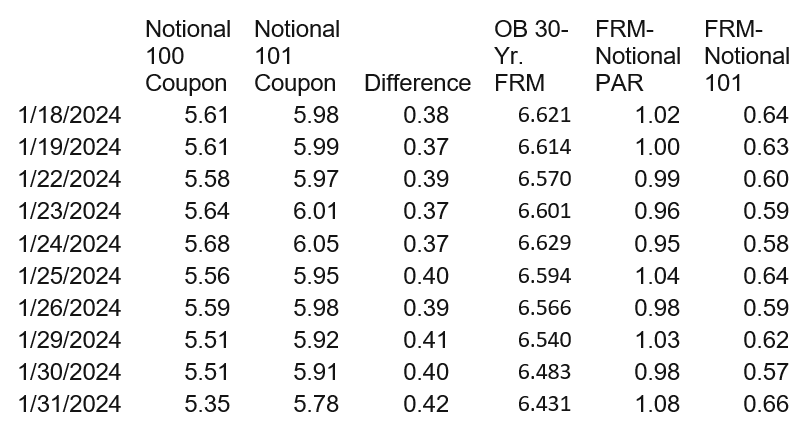
Note that the spread between the “notional 101” MBS coupon and the OB 30-year rate is not that different from a 25 bp servicing fee plus a GSE Gfee for top quality borrowers.
Flipping back to mortgage/10-Year Treasury spreads, for folks who want a “Q&D” model of the 30-Year FRM, here would be my recommendation:
30-Year FRM = 0.30 + .875 *10Y T +.125*3MT +.0068*MOVE + OAS + 1.00
Where OAS is from Yield Book.
E.g., if the 10Y Treasury were 4.06%, the 3M Treasury were 5.45%, the MOVE Index were 110.4, and the YB OAS were 30 bp, then the estimated 30 Year FRM would be 6.58%, and the FRM/10 Year spread would be 252 bp. (These Treasury rates, MOVE levels, and YB OAS are January monthly averages. The OB 30 Year FRM average for January was 6.56%.)
If the 10Y Treasury were 4.25%, the 3M Treasury were 3.45%, the MOVE Index were 90, and the YB OAS were 40 bp, then the estimated 30-year FRM would be 6.46%, and the FRM/10-Year spread would be 201 bp.
And if the 10Y Treasury were 3.75%, the 3M Treasury were 5%, the MOVE Index were 125, and the YB OAS were 40 bp, then the estimated 30-year FRM would also be 6.46%, and the FRM/10-Year spread would be 271 bp.
Of course, most people don’t have access to Yield Book OAS. And even for folks have some historical data, the history since the financial crisis includes several extended period where excessive Fed intervention in the MBS market resulted in negative OAS. My “gut” is that an assumption of a long run average in the 35-40 bp range is probably reasonable.
