Calculated Risk
Year-over-Year: Sales Down Sharply, Inventory Increased, New Listings Down
by Bill McBride
The big story for February existing home sales was the sharp year-over-year (YoY) decline in sales, and also the rebound from the low level of sales in December and January. Also, active inventory increased sharply YoY, but is still historically low – and new listings are down YoY.
This is the final look at local markets in February. I’m tracking about 40 local housing markets in the US. Some of the 40 markets are states, and some are metropolitan areas. I update these tables throughout each month as additional data is released.
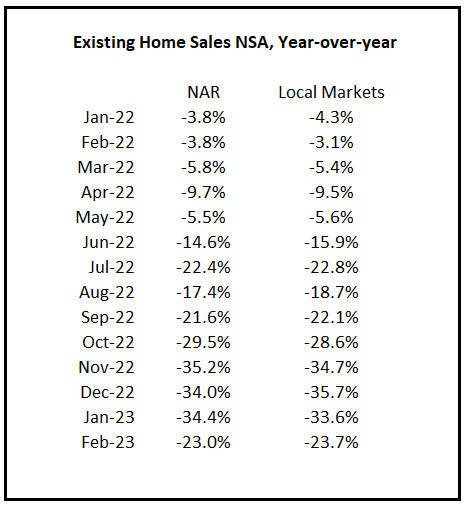
First, here is a table comparing the year-over-year Not Seasonally Adjusted (NSA) declines in sales this year from the National Association of Realtors® (NAR) with the local markets I track. So far, these measures have tracked closely. The NAR reported sales were down 23.0% NSA YoY in February.
Active Inventory in February
Here is a summary of active listings for these housing markets in February.
Inventory in these markets were down 22% YoY in February 2022 and are now up 42% YoY! So, this is a significant change from early 2022, although this is a smaller YoY inventory increase than in January (up 49% YoY).
Notes for all tables:
- New additions to table in BOLD.
- Northwest (Seattle), Santa Clara (San Jose), Jacksonville, Source: Northeast Florida Association of REALTORS®
- Totals do not include Atlanta, Denver or Minneapolis (included in state totals)
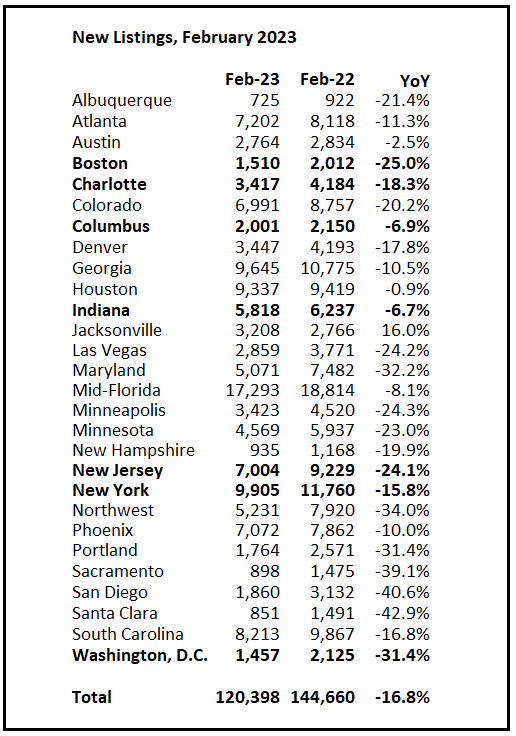
New Listings in February
And here is a table for new listings in February. For these areas, new listings were down 16.8% YoY. Potential sellers that are locked into their current homes with low mortgage rates has pushed down new listings.
Last month, new listings in these markets were down 8.4% YoY. This is a larger YoY decline in new listings, and similar to the YoY declines in October, November and December.
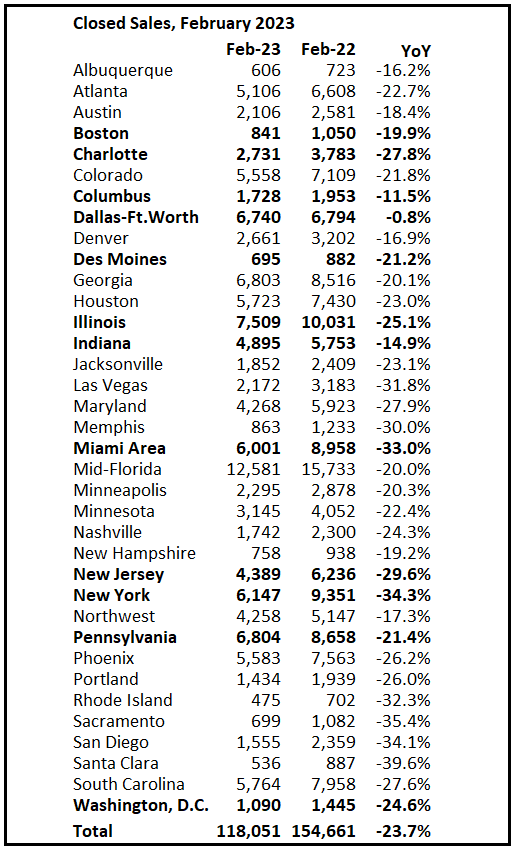
Closed Sales in February
And a table of February sales.
In February, sales in these markets were down 23.7%. In January, these markets were down 33.7% YoY Not Seasonally Adjusted (NSA).
Note: Even if existing home sales activity bottomed in December (4.03 million SA) and January (4.00 million SA), there are usually two bottoms for housing – the first for activity and the second for prices.
My early expectation is we will see a similar YoY sales decline in March as in February, since mortgage rates for contracts signed in January and February were about the same level as contracts that closed in February.