CALCULATEDRISK
By Bill McBride
After the National Association of Realtors® (NAR) releases the monthly existing home sales report, I pick up additional local market data that is reported after the NAR. This is the final look at local markets in January.
I’ve added a comparison of active listings, new listings, and closings to the same month in 2019 (for markets with available data). This gives us a sense of the current low level of sales and inventory, and also shows some significant regional differences.
The big stories for January were that existing home sales were very low, at 4.00 million on a seasonally adjusted annual rate basis (SAAR), and new listings were up YoY for the 4th consecutive month!
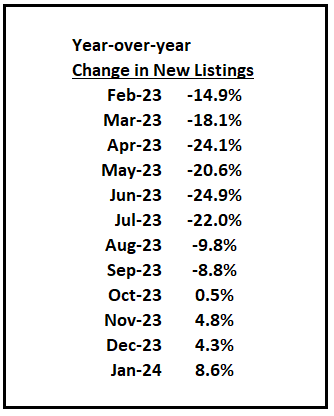
This table shows the YoY change in new listings since early 2023 for the sample I track. This is the slow season for new listings, but it is likely new listings will be up solidly YoY in 2024.
Active Inventory in January
Here is a summary of active listings for these housing markets in January.
Inventory for these markets were down 1.3% year-over-year in December and are now up 3.0% year-over-year. A key will be if inventory builds over the next few months.
Inventory is down sharply in almost all of these areas compared to 2019.
Notes for all tables:
- New additions to table in BOLD.
- Northwest (Seattle), Jacksonville Source: Northeast Florida Association of REALTORS®
- Totals do not include Atlanta, Denver and Minneapolis (included in state totals)
- Comparison to 2019 ONLY includes local markets with available 2019 data!
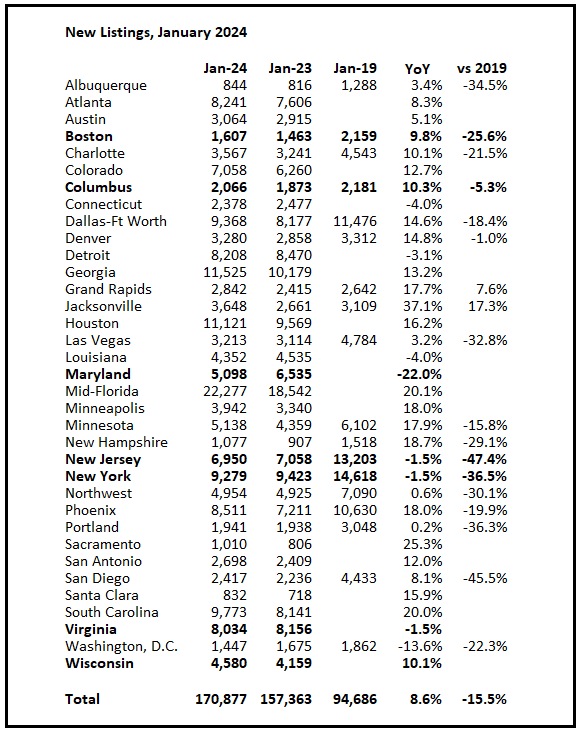
New Listings in January
And here is a table for new listings in January (some areas don’t report new listings). For these areas, new listings were up 8.6% year-over-year.
Last month, new listings in these markets were up 4.3% year-over-year.
New listings are now up year-over-year, but still at historically low levels. New listings in almost all of these areas are down compared to January 2019 activity.
Closed Sales in January
And a table of January sales.
In January, sales in these markets were up 3.0%. In December, these same markets were down 7.9% year-over-year Not Seasonally Adjusted (NSA).
Sales in most of these markets are down sharply compared to January 2019.
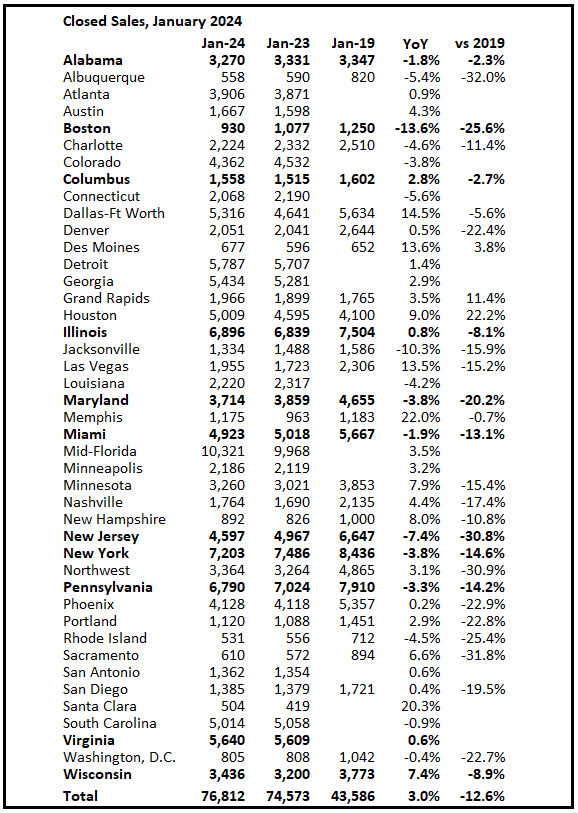
This was a year-over-year increase NSA, compared to a YoY decline in December for these markets. However, there was one more working day in January 2024 compared to January 2023, so sales Seasonally Adjusted were down YoY.
Note that closed sales in January were mostly for contracts signed in November and December. Mortgage rates, according to the Freddie Mac PMMS, averaged around 7.4% in November and 6.8% in December.
February sales will be mostly for contracts signed in December and January and mortgage rates declined to an average of 6.6% in January. My early expectation is we will see a slight increase of sales in February on a seasonally adjusted annual rate basis (SAAR) compared to January. There was one more working day in February 2024 compared to February 2023, so seasonally adjusted sales will be lower than the NSA data suggests.
This graph shows existing home sales by month for 2023 and 2024. This was the twenty-ninth consecutive month with sales down year-over-year. Sales were just above the cycle low of 3.85 million SAAR in October 2023.
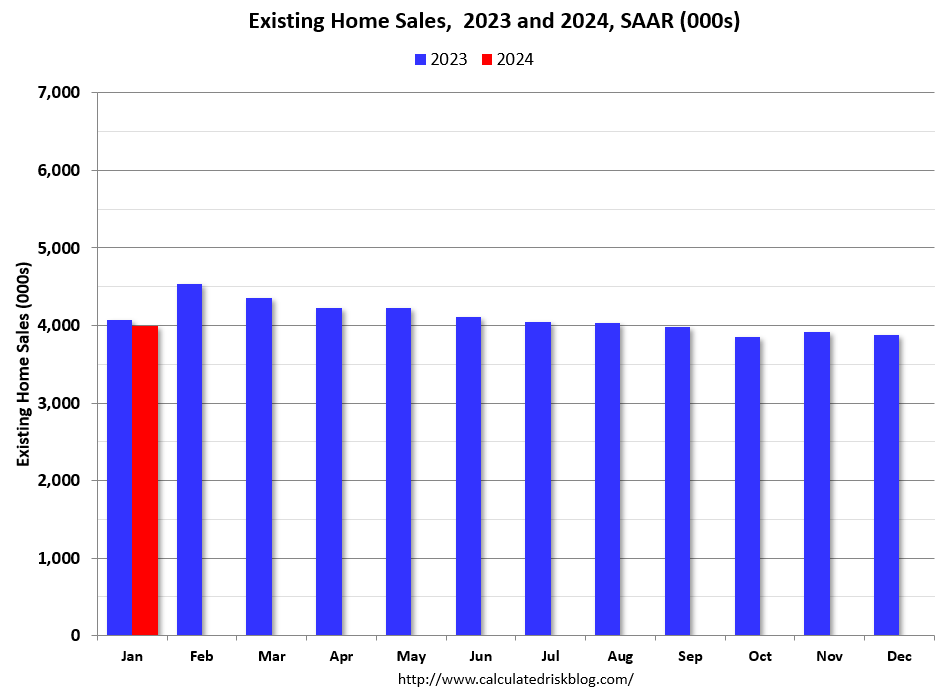
It is unlikely sales will be up year-over-year in February since sales were reported at 4.53 million SAAR in February 2023. The comparison will be easier later in the year.