Year-over-Year: Sales Down Sharply, Inventory Increased, New Listings Down
CALCULATED RISK
By Bill McBride
Every month I track about 40 local housing markets in the US to get an early sense of changes in the housing market. After the National Association of Realtors® (NAR) releases the monthly existing home sales report, I pick up additional local market data that is reported after the NAR (and I’m frequently adding more markets). This is the final look at local markets in March.
The big story for March existing home sales was the sharp year-over-year (YoY) decline in sales. Also, active inventory increased YoY, but is still historically low – and new listings were down YoY.
Active Inventory in March
Here is a summary of active listings for these housing markets in March.
Inventory in these markets were up 31% YoY in March, although this is a smaller YoY inventory increase than in February (up 39% YoY).
I try to gather only active inventory; however, I think some of these sources include pending sales.
Notes for all tables:
- New additions to table in BOLD.
- Northwest (Seattle), Santa Clara (San Jose), Jacksonville, Source: Northeast Florida Association of REALTORS®
- Totals do not include Atlanta, Denver or Minneapolis (included in state totals)
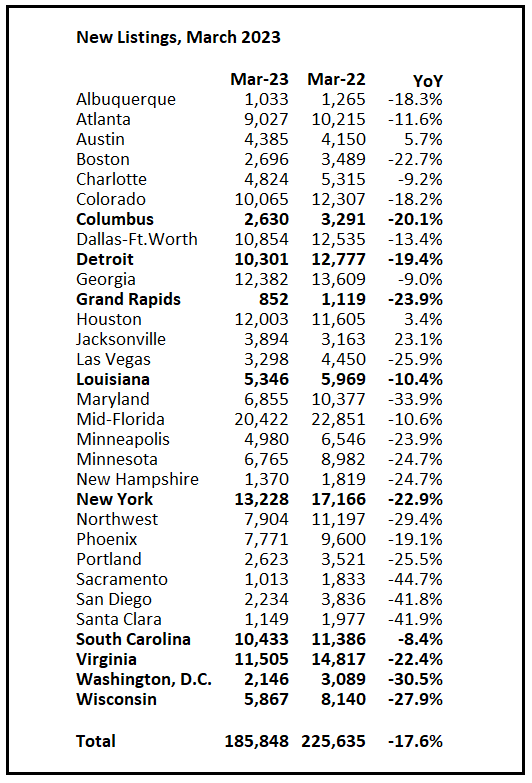
New Listings in March
And here is a table for new listings in March (some areas don’t report new listings). For these areas, new listings were down 17.6% YoY. Potential sellers that are locked into their current homes with low mortgage rates has pushed down new listings.
Last month, new listings in these markets were down 16.4% YoY. Note that a few areas like Austin, Jacksonville and Houston continue to be outliers with new listings up YoY.
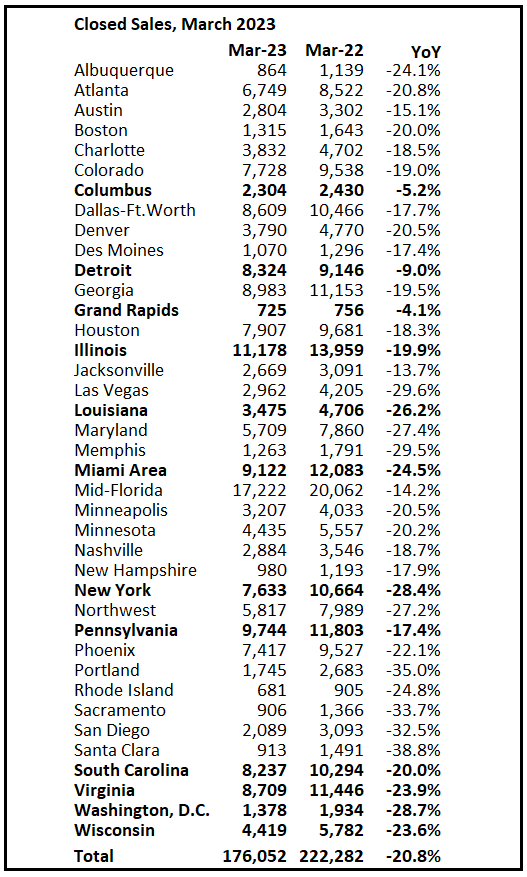
Closed Sales in March
And a table of March sales.
In March, sales in these markets were down 20.8%. The NAR reported sales were down 21.1% NSA YoY in March. These local markets have closely tracked the NAR report.
The March existing home sales report showed another significant YoY decline, and it was the 19th consecutive month with a YoY decline in sales.
Note: Even if existing home sales activity bottomed in December (4.03 million SA) and January (4.00 million SA), there are usually two bottoms for housing – the first for activity and the second for prices.
My early expectation is we will see a somewhat similar YoY sales decline NSA in April as in March. Even though mortgage rates were higher for contracts signed in March (closed sales in April will be mostly for contracts signed in February and March) sales were already declining in March 2022, as 30-year mortgage rates moved above 4% for the first time since early 2019 (yes, rates were below 4% prior to the pandemic).