Austin Prices Down 12.4% from Peak Seasonally Adjusted
CALCULATEDRISK
By Bill McBride
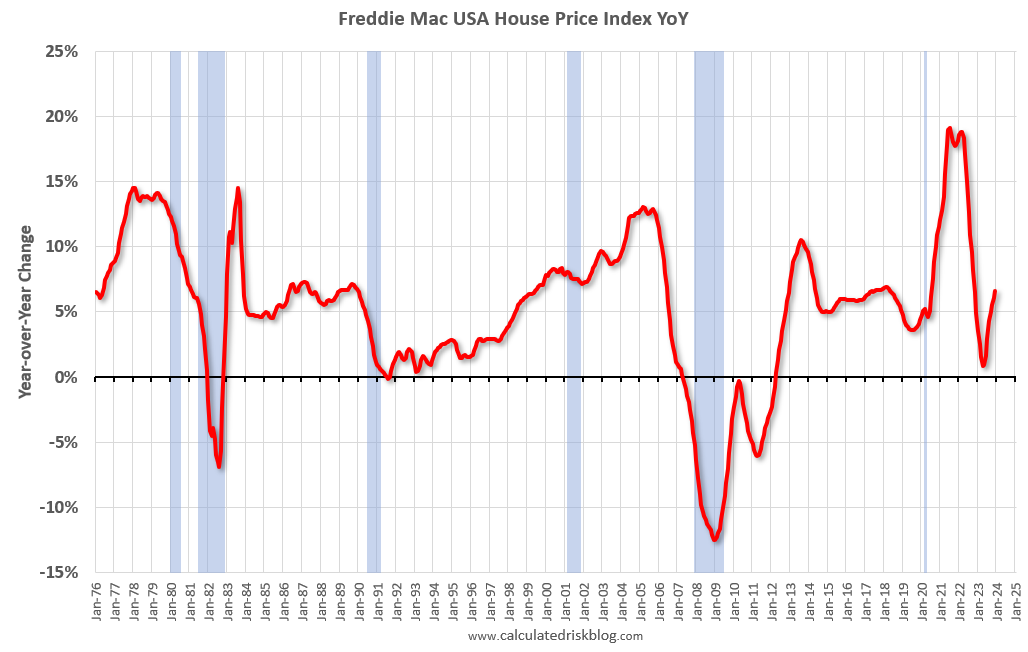
Freddie Mac reported that its “National” Home Price Index (FMHPI) increased 0.6% month-over-month on a seasonally adjusted (SA) basis in November. On a year-over-year basis, the National FMHPI was up 6.6% in December, from up 6.1% YoY in November. The YoY increase peaked at 19.1% in July 2021, and for this cycle, bottomed at up 0.9% YoY in April 2023.
The second graph shows the month-over-month change in the national FMHPI, seasonally adjusted. The index has increased for twelve consecutive months after declining MoM for seven consecutive months.
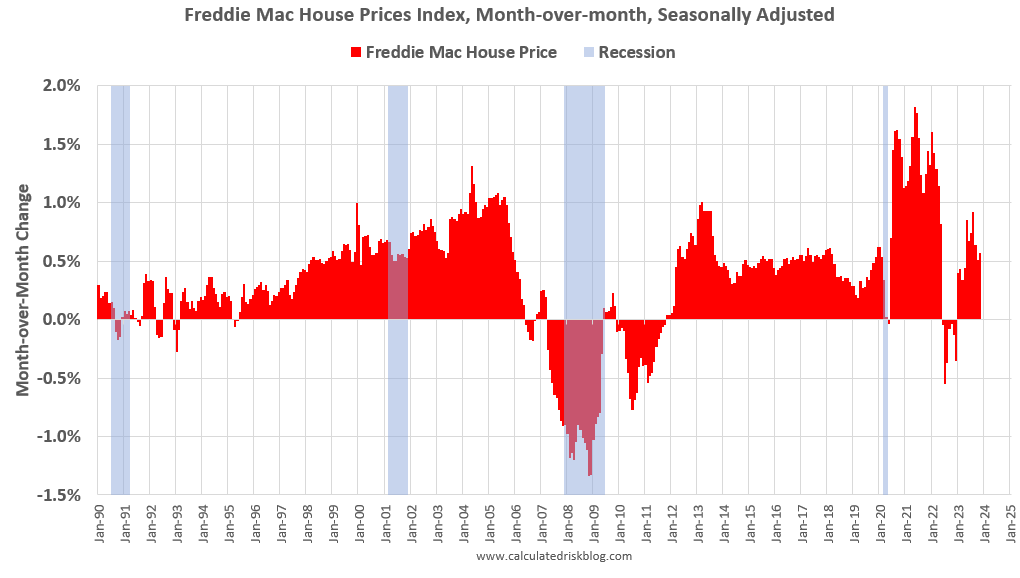
The FMHPI was up 0.4% MoM in December, a less than the average for the previous six months. Over the last 6 months, this index has increased at an 7.9% annual rate!
10 States have seen price declines Seasonally Adjusted
As of December, 10 states were below their previous peaks, Seasonally Adjusted. The largest seasonally adjusted declines from the recent peak were in Maine (-3.4%), Idaho (-2.3%), Louisiana (-1.9%), and Washington (-1.8%).
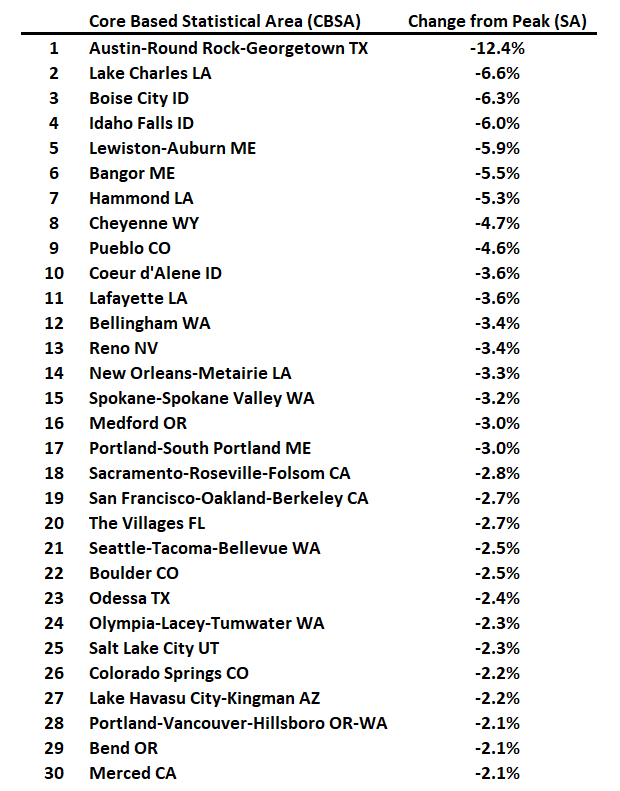
For cities (Core-based Statistical Areas, CBSA), here are the 30 cities with the largest declines from the peak, seasonally adjusted. Austin continues to be the worst performing city.
Here is a comparison of year-over-year change in the FMHPI, median house prices from the NAR, and the Case-Shiller National index.
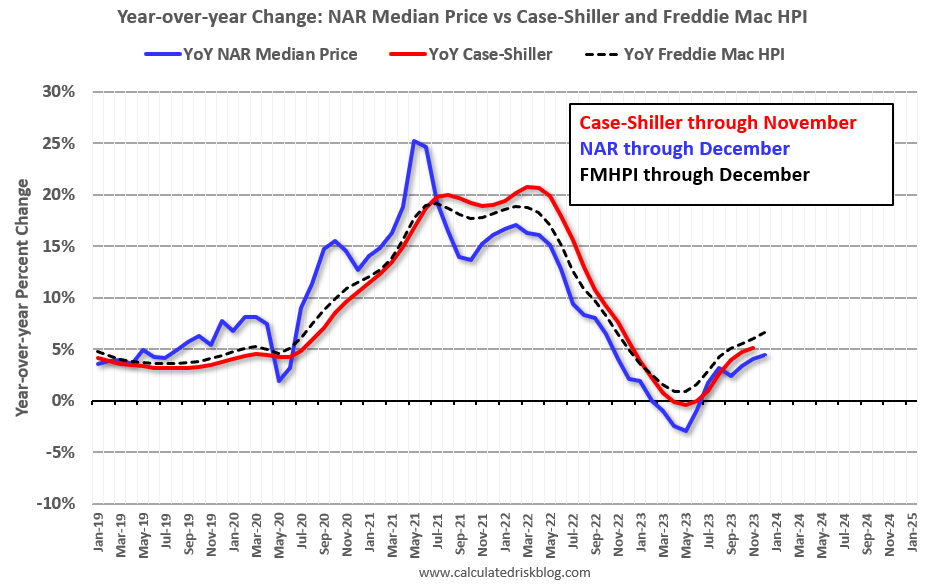
The FMHPI and the NAR median prices appear to be leading indicators for Case-Shiller. The Case-Shiller index was up 5.1% YoY in November. The FMHPI is suggesting a further YoY increase in the Case-Shiller index.