By Mike Simonsen
Available inventory of homes on the market actually fell this week as American home buyers continue to defy expectations. Even as difficult affordability curtails some demand, new supply remains incredibly restricted. And, home prices — which are flat to down year over year — are inching up each week. This data is creating a surprising supply and demand equation.
Inventory
Available inventory of single-family homes for sale actually dipped this week to 419,000. It was a small drop, but a decline nonetheless. Inventory will likely climb again next week, but it’s yet another indication that there are very few sellers and even more buyers than supply will allow.
The inventory difference compared to 2022 continues to shrink. Watch the dark red line in the chart below for 2023 compared to the light red line from 2022. It could be as early as July until we have year-over-year declines in inventory. At the beginning of the year, there was 75% more inventory than in 2022. Last spring inventory was rising 4-6% per week. At the time the brakes had slammed on demand, and there were still sellers who were trying to squeeze in before rates jumped too far too fast. At the time, the data was looking bearish for home prices and we thought that we might finally get back to normal levels of available homes to buy.
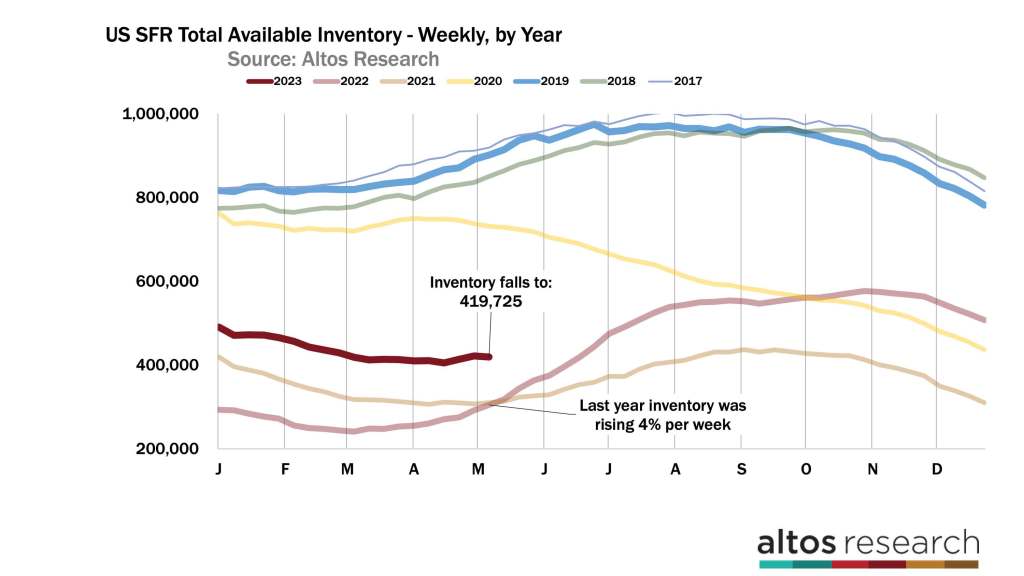
At the start of 2023, the data seemed to show that inventory could continue to grow with a slowing economy and get close to the 800,000 level that it used to be at, but those hopes are essentially gone now.
Because of all those factors, it has been hard to understate this market rebound of this spring. It was just February when there were 79% more listings on the market than in 2022. That difference is down to 37% now. There are still 37% more homes on the market now than in 2022 at this time. The difference is compressing so quickly that you can imagine it might be as soon as July when we have fewer homes on the market than last year. Negative year-over-year inventory change by July would be shocking to me. I never saw that coming.
According to the data, we only have eight to 10 more weeks of the seasonal inventory growth, which typically peaks on July 1. Yet, inventory is not growing right now. Only 77,000 new listings came on the market this week with 19,000 of those already in contract. In the chart below, each bar represents the total new listings volume each week. Its now May, but according to the data the volume of sellers looks more like typical trends for February or March. In 2022, 105,000 single-family homes were listed in the first week of May.
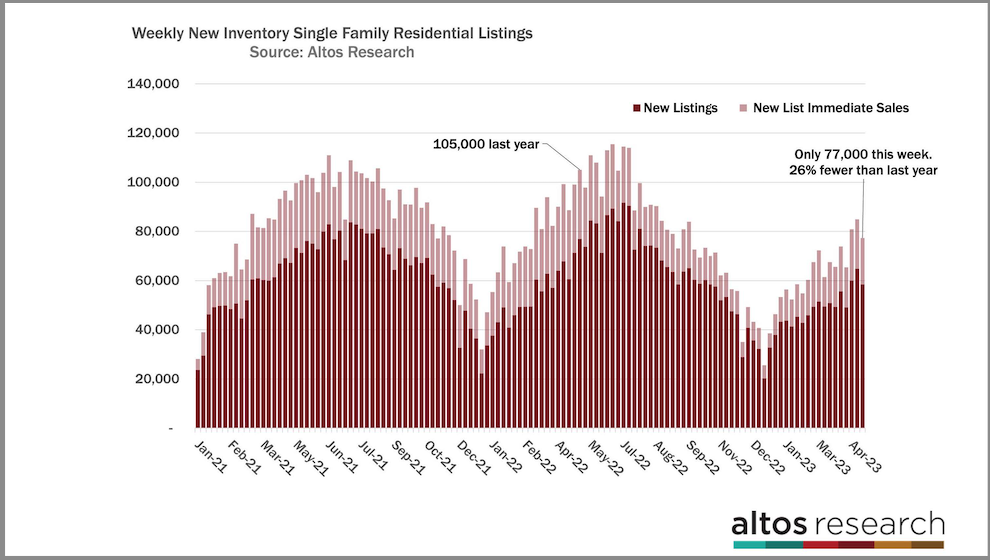
According to that data, there were 26% fewer new sellers this week than the same week in 2022. This is why I say we’re in a supply-constrained market. So even though affordability is significantly more difficult for buyers now, there are sufficient buyers at these prices and these rates for the very few homes available.
The light red portion of the bar in the chart represents the immediate sales. There were 19,000 of those this week. That’s fractionally fewer than the past couple of weeks. But it shows us that there is home buyer demand, in addition to the limited supply.
Price
The rest of May should indeed lead to a few more price reductions. Homes that got listed in April — and are still on the market now — will take price cuts. Price reductions increased this week to 29.4%. That’s more than the crazy COVID-19 pandemic demand trends, but it is fewer than the data from 2019. When you compare this year’s price reductions curve to previous years, the data shows our inventory was so late in arriving this year that the price reductions are hitting later too. However, demand is pretty quick for this limited supply.
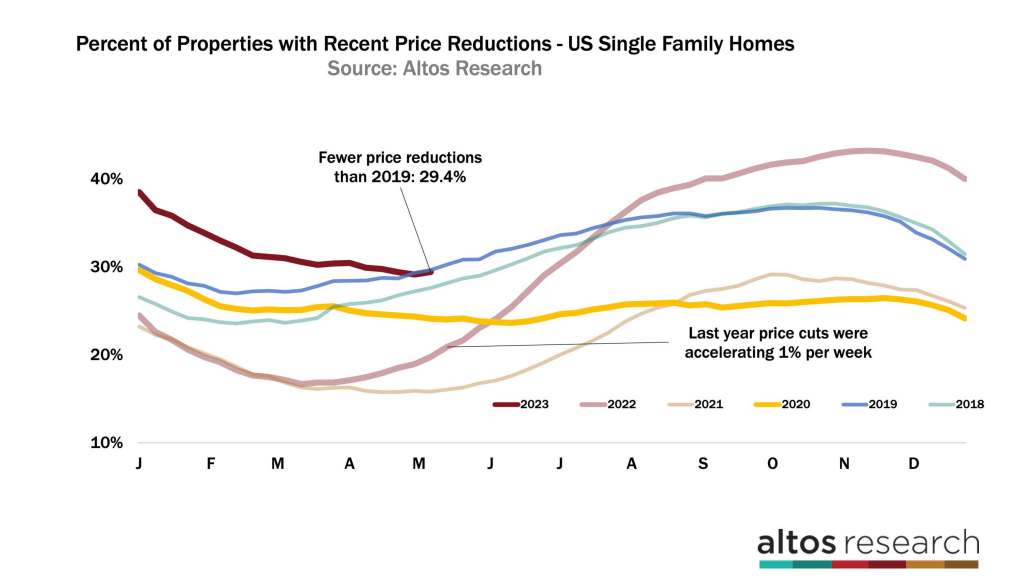
The light red line, representing 2022, shows that each week we had many more price cuts. See how it was rising so rapidly? Inventory was building at the time and demand was frozen solid. Sellers knew this, and their price cuts were accelerating. Spring price reductions translated into lower sales prices when those transactions close in August and September of 2022.
This year, price cuts have been dramatically fewer and slower to arrive. These data points are yet another really clear signal that demand is sufficient for sellers. When the economy and poor affordability curtail buyers, the data will show price reductions accelerating again. If your hypothesis is that the economy, over-leveraged consumers, student loans, inflation or whatever stops home buyer demand, you’ll see the price reduction data turn just like it did in March 2022. Keep your eyes out for that.
Given the limited available supply and the high demand, it’s no surprise that home prices keep increasing as you’d expect for the spring and the seasonal peak we’re nearing. The median price of single-family homes in the U.S. this week is $449,000. That’s up a fraction from last week. It’s still a touch higher than last year at this time. But, the annual price gain is shrinking. This trend has continued for the past few months, and it will keep shrinking until early July.
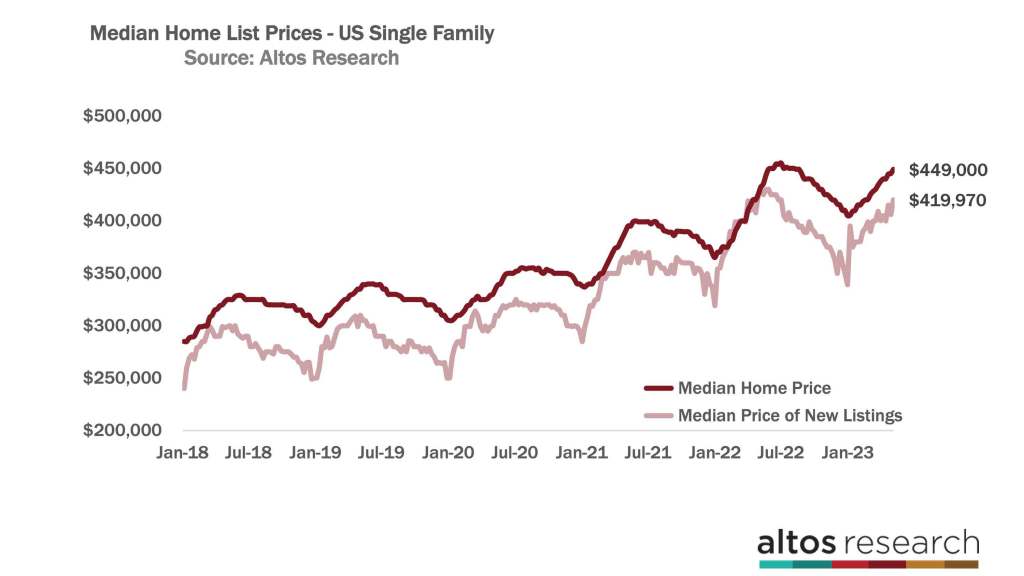
The median price of the new listings increased a little this week to $419,970. This new data point could be sellers knowing that demand is out there, but I don’t think it’s a strong trend. While the new listings price is up a couple of percentage points from last week, it’s also a few percentage points lower than in 2022 at this time. Two of the Altos price measures are lower than last year, only one is higher.
Sometimes when we talk about restricted supply and sufficient demand, people assume I’m saying that home prices must also be jumping up. But that’s not what we’re seeing. In 2022, home prices in April and May were still tied to the peak of the COVID-19 pandemic buying frenzy. This year, the price signals are much weaker.
Now, the data shows demand at these prices and these mortgage rates, but there is no evidence of home prices climbing further. There are a few more weeks of the seasonal price climbs but that seasonality is not particularly notable.
The median price of the homes in contract also inched up a tiny bit this week to $380,433. While that’s up from last week, it’s lower than in 2022 at this time. 2.2% lower. Remember that the homes in contract now will close in May, June and July. So, the headlines in July and August will still be talking about home price declines. Those declines took place last fall and the annual comparisons are lagging.
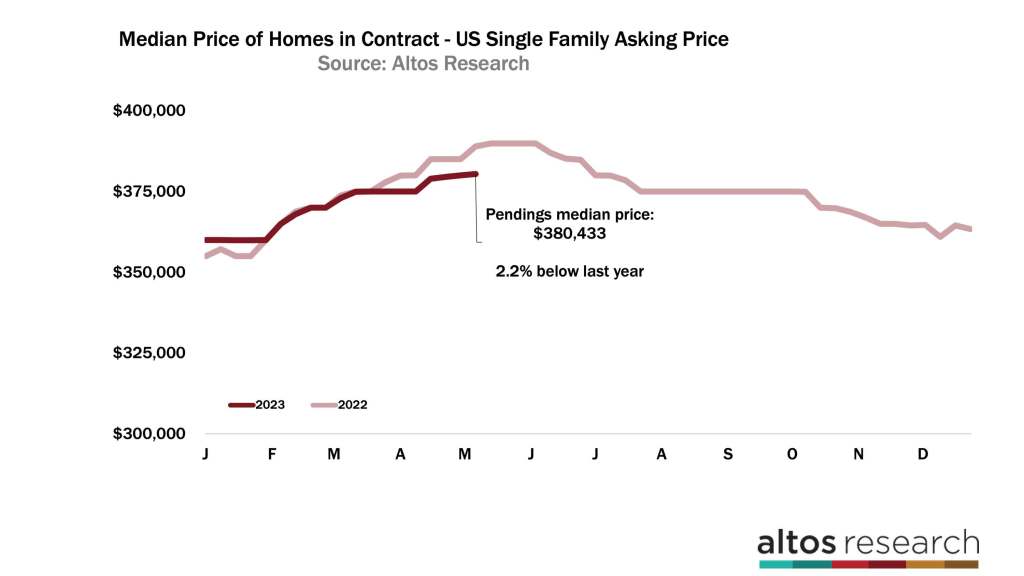
I can imagine that by July we could be back to year-over-year price gains in the pending sales data. That information will start to show up in the headlines later in the year. It will be very interesting to see if we end the year with just tiny home price gains. We’re still expecting home prices to be down slightly to complete the year. In June, we’ll see the first opportunity for that story to change. If the economy holds up, 2023 could end with home price gains. If the recession finally hits, then there could be a late year dip that stops the slight price momentum we have now.
A true data geek, Mike founded Altos Research in 2006 to bring previously unavailable insights on the US housing market to those who need it. The company now serves the largest Wall Street investment firms, banks, and tens of thousands of real estate professionals around the country. During the pandemic, Mike used Altos Research data to identify trends in the real estate market well before the headlines, and his work was recently featured in the New York Times, The Atlantic and other publications. Mike was also the 2020 president of the San Francisco Chapter of the Entrepreneurs’ Organization, a group in which he gets to lead and learn from hundreds of the most exciting entrepreneurs in the world.