CALCULATEDRISK
By Bill McBride
One of the keys for housing demand is demographics. This month the Census Bureau released their estimates of the U.S. population by age for July 2024. The following graph is based on the release for 2024. Note that the largest age group is in their early-to-mid 30s. There are still a number of younger Boomers in their early-to-mid 60s.

I’ll return to the above graph and discuss some of the implications for the next decade, but first, here is a similar graph for July 2010.
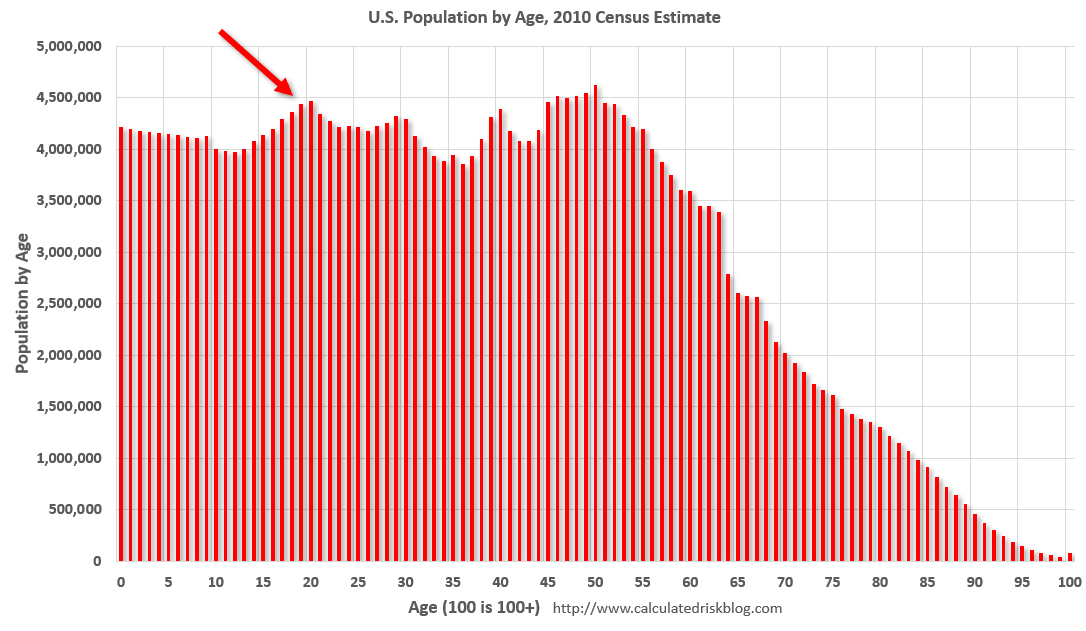
The arrow points to the large cohort moving into the key renter age group in 2010. It was fifteen years ago that we started discussing the turnaround for apartments. Then, in January 2011, I attended the NMHC Apartment Strategies Conference in Palm Springs, and the atmosphere was very positive. The drivers were 1) very low new supply, and 2) strong demand (favorable demographics, and people moving from owning to renting).
Looking at demographics helped me call the bottom for rents and multi-family construction. And sure, enough multi-family starts bottomed around 2010.

What are the implications for the next decade?
I’ve circled two key cohorts on the 2024 graph. The first group – in their early-to-mid 30s – are at a key home buying age. This was a factor in the surge in home buying in 2020, 2021 and early 2022 (along with low mortgage rates). The cohort that follows this group is smaller, so there will be less homebuying demand going forward.
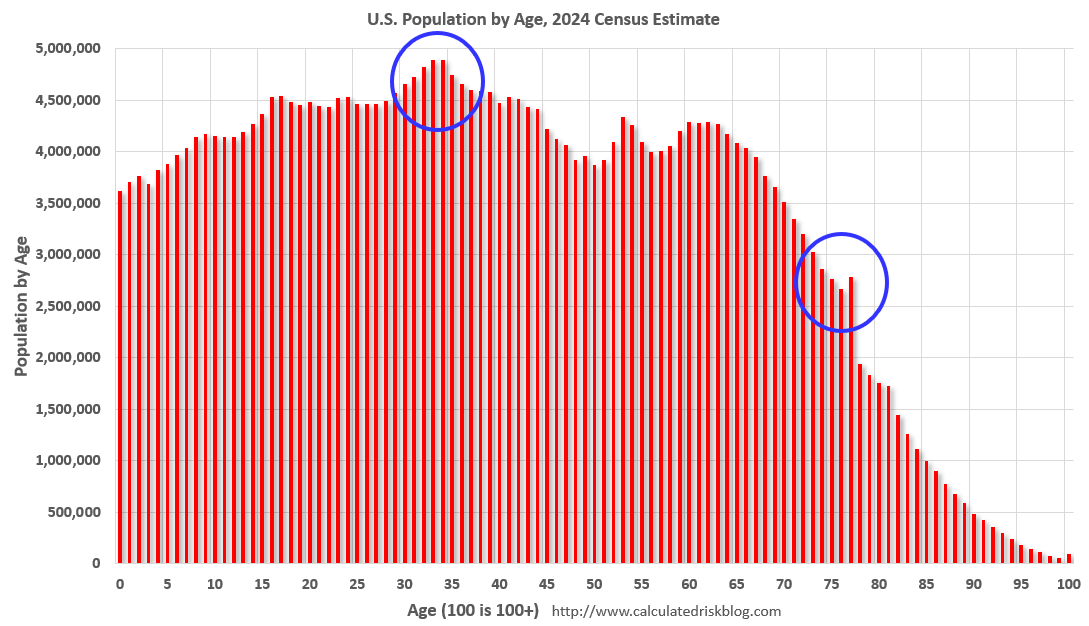
The second group is the leading edge of the Baby Boom generation that are now around 77. No cohort is monolithic – some people will age-in-place until they pass away, others will move in with family (or family will move in with their parents), and some will move to retirement communities. There is no magic age that people reach and start to transition to retirement homes, but looking at prior generations, it seems to start when people are around 80 years old.
My sense is there will be a pickup in Boomers selling their homes in a few years and lasting until 2040 or so. These homes will be older – and most will need updating – but many of these homes will be in prime locations. We should also see a pickup in retirement community construction during that time period.
Put together, the 1st circle suggests less homebuying demand in the next decade and the 2nd circle suggests more existing supply. There are other factors, but this will likely hold down house prices.
Census Projections for 2035
Here are two more graphs based on the 2023 Census projections for the year 2035.
The first graph is the “Main Series” projection.

By 2035, the cohort that was in their early-to-mid 30s will be in their 40s (less of a homebuying age). And a large number of Baby Boomers will be their 80s – many moving to retirement communities. Also note the bump in the mid-30s, this was likely due to immigration projections.
The last graph shows three different projections by 5-year age groups: the Main series, low immigration and no immigration.

Note that most of the projected immigration is in 0 to 50 age groups. Less or no immigration will lower demand for housing.
Demographics is just part of the puzzle, but this suggests less homebuying demand and more existing supply in the next decade.