By Logan Mohtashami
We only have 2.6 months’ worth of housing inventory in the U.S. after coming off the single biggest home-sales crash year in history. That is where we are today in America. As expected, existing home sales fell from February to March since the previous month’s report was intense.
We have a workable range for 2023 sales in the existing home sales market between 4 million and 4.6 million. If we are trending below 4 million — a possibility with new listing data trending at all-time lows — then we have much weaker demand than people think. Now if we get a few sales prints above 4.6 million, then demand is better than the initial bounce we had earlier in the year.
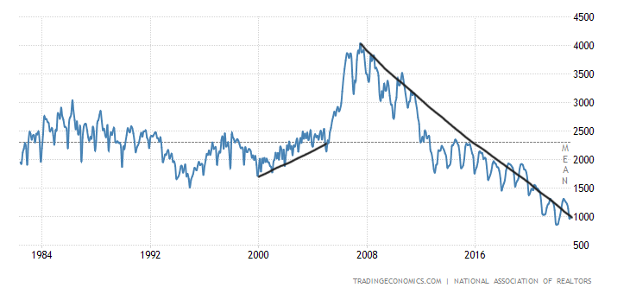
To get back to the pre-COVID-19 sales range, we need to see existing home sales trend between 4.72 – 5.31 million for at least 12 months. That isn’t happening. We are working from a low bar, and as I have stressed over the years, it’s sporadic post-1996 to have a monthly sales trend below 4 million. In the chart below, with the red lines drawn, you can see how different the sales crash in 2022 was compared to the last two times rates rose and sales fell.
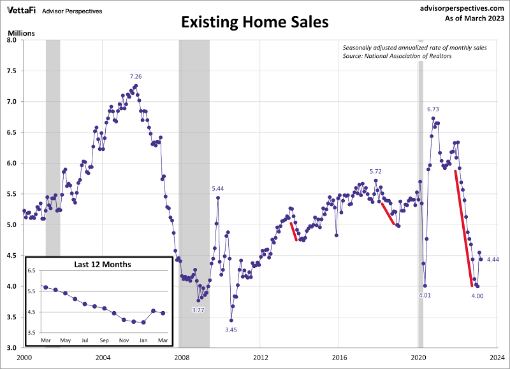
From NAR: Total existing-home sales – completed transactions that include single-family homes, townhomes, condominiums, and co-ops – fell 2.4% from February to a seasonally adjusted annual rate of 4.44 million in March. Year-over-year, sales waned 22.0% (down from 5.69 million in March 2022).
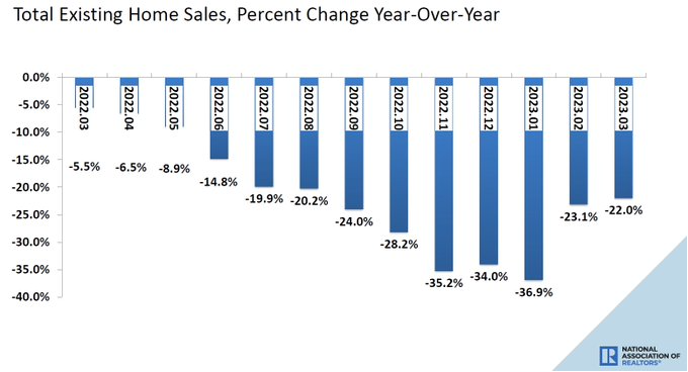
Last year we had a significant sales decline for the existing home sales market, which got worse as the year progressed. When looking at year-over-year data for the rest of the year, we have to remember that the year-over-year sales declines will improve just because the comps will get easier. That will pick up speed toward the second half of 2023 and we could see some positive year-over-year data toward the end of the year.
NAR: Year-over-year, sales waned 22.0% (down from 5.69 million in March 2022).
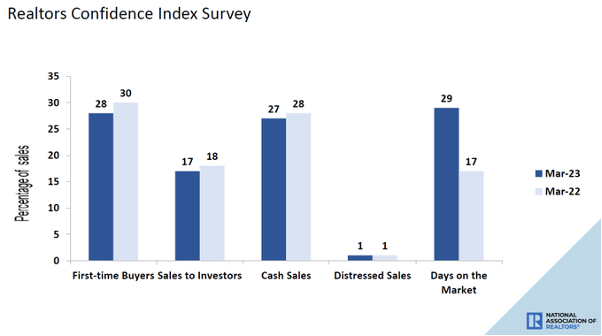
One aspect I didn’t like to see in this report is that the days on market fell and are back to under 30 days. This is the reality of our world: total active listings are still near all-time lows and demand so far has been stable since Nov. 9, 2022.
As we can see in the data below, the days on the market fell back down to 29 days. I am hoping that it doesn’t go lower than this. For some historical context, back in 2011, this data line was 101 days.
NAR: First-time buyers were responsible for 28% of sales in March; Individual investors purchased 17% of homes; All-cash sales accounted for 27% of transactions; Distressed sales represented 1% of sales; Properties typically remained on the market for 29 days.
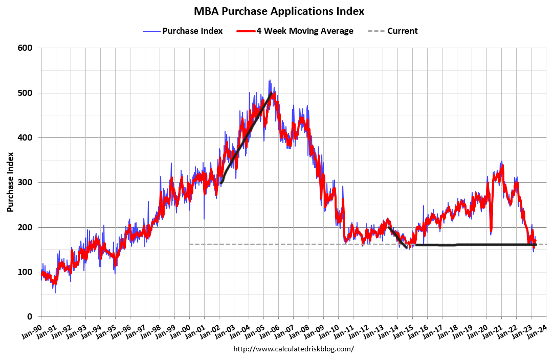
When I talk about stabilization in demand since Nov. 9, I am looking at purchase application data since that date, and — excluding some holiday weeks that I don’t put any weight on —we have had 15 positive prints versus six negative prints in that time. So, while the chart below doesn’t look like what we saw in the COVID-19 recovery, it has stabilized.
I put the most weight on this data line from the second week of January to the first week of May. After May, traditionally speaking, total volumes usually fall. Now, post-2020, we have had three straight years of late-in-the-year runs in this data line to mess everything up. However, sticking to my past work, I have seen eight positive prints versus six negative prints this year. So, I wouldn’t call this a booming demand push higher, just a stabilization period using a low bar.
NAR: Total housing inventory registered at the end of March was 980,000 units, up 1.0% from February and 5.4% from one year ago (930,000). Unsold inventory sits at a 2.6-month supply at the current sales pace, unchanged from February but up from 2.0 months in March 2022.
Total housing inventory, while up year over year, is still near all-time lows, and monthly supply is also up year over year. However, as we all know, housing inventory reached an all-time low in 2022, so you need context when talking about the year-over-year data. As we can see below, from 2000, total active housing inventory rose from 2 million to 2.5 million before we saw the massive stress spike in supply from 2005 to 2007.
The NAR data looks a bit backward, so if you want more fresh weekly data, I write the Housing Market Tracker every week on Sunday night to give you that information.
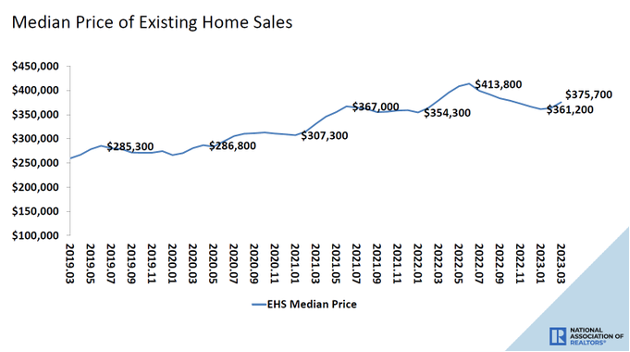
One thing higher mortgage rates have done for sure is that home-price growth is cooling down noticeably since the big spike in rates. That growth isn’t cooling as much as I would like, tied to my years 2020-2024 price-growth model for a stable housing market. However, I will take what I can get at this point.
NAR: The median existing-home price for all housing types in March was $375,700, a decline of 0.9% from March 2022 ($379,300). Price climbed slightly in three regions but dropped in the West.
The most shocking data we have seen in the housing market since the big crash in home sales is how low inventory still is in the U.S. — except for those reading HousingWire or listening to the HousingWire Daily podcast.
Remember, inventory channels are different now because credit channels in the U.S. are different post-2010. Also, demand has stabilized since Nov. 9, so when we talk about housing in the U.S., let’s use the data that makes sense.
Stable demand, low housing inventory, and no forced sellers are why we created the weekly Tracker, to focus on accurate data and what matters most to housing economics and the U.S. economy.
Logan Mohtashami is a housing data analyst, financial writer, and blogger covering the U.S. economy specializing in the housing market. Logan is also a Lead Analyst for HousingWire. Mohtashami has been an invited speaker at the Americatlyst, the California Association Of Realtors, and many other economic conferences. Logan Mohtashami, now retired, has been called a social media star by National Mortgage News and “the chart guy.” Mohtashami’s astute analysis of economic data and years of direct lending experience allows him to present a unique, informed, and unbiased perspective on the financial markets.