The Gandalf line in the sand for the 10-year yield held again
By Logan Mohtashami
Last week was relatively calm for the housing market after the fiasco of the banking crisis. Housing demand grew and inventory levels fell again while mortgage rates rose.
Here’s a quick rundown of the last week:
- The 10-year yield battle continues as bond yields rose early in the week only to close below 3.50% on Friday. Mortgage rates rose to 6.57%.
- Active inventory fell by 3,141, and new listing data fell again and is still trending at all-time lows.
- Purchase applications data rose for the fourth straight week, which continues the streak of 2023, having more positive weekly data than negative.
The 10-year yield and mortgage rates
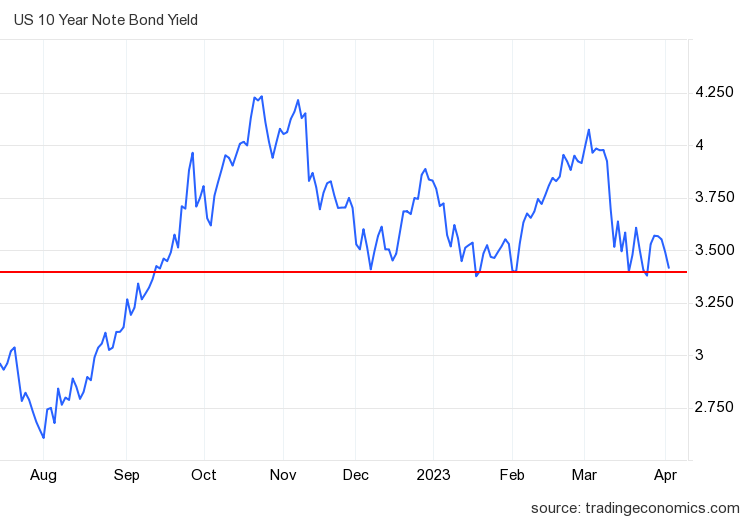
Last week was interesting for the 10-year yield and mortgage rates. Even though the Gandalf line in the sand (3.37%-3.42%) held firm and the 10-year yield reversed higher, it didn’t reverse with much of a kick this time, closing Friday below 3.50%.
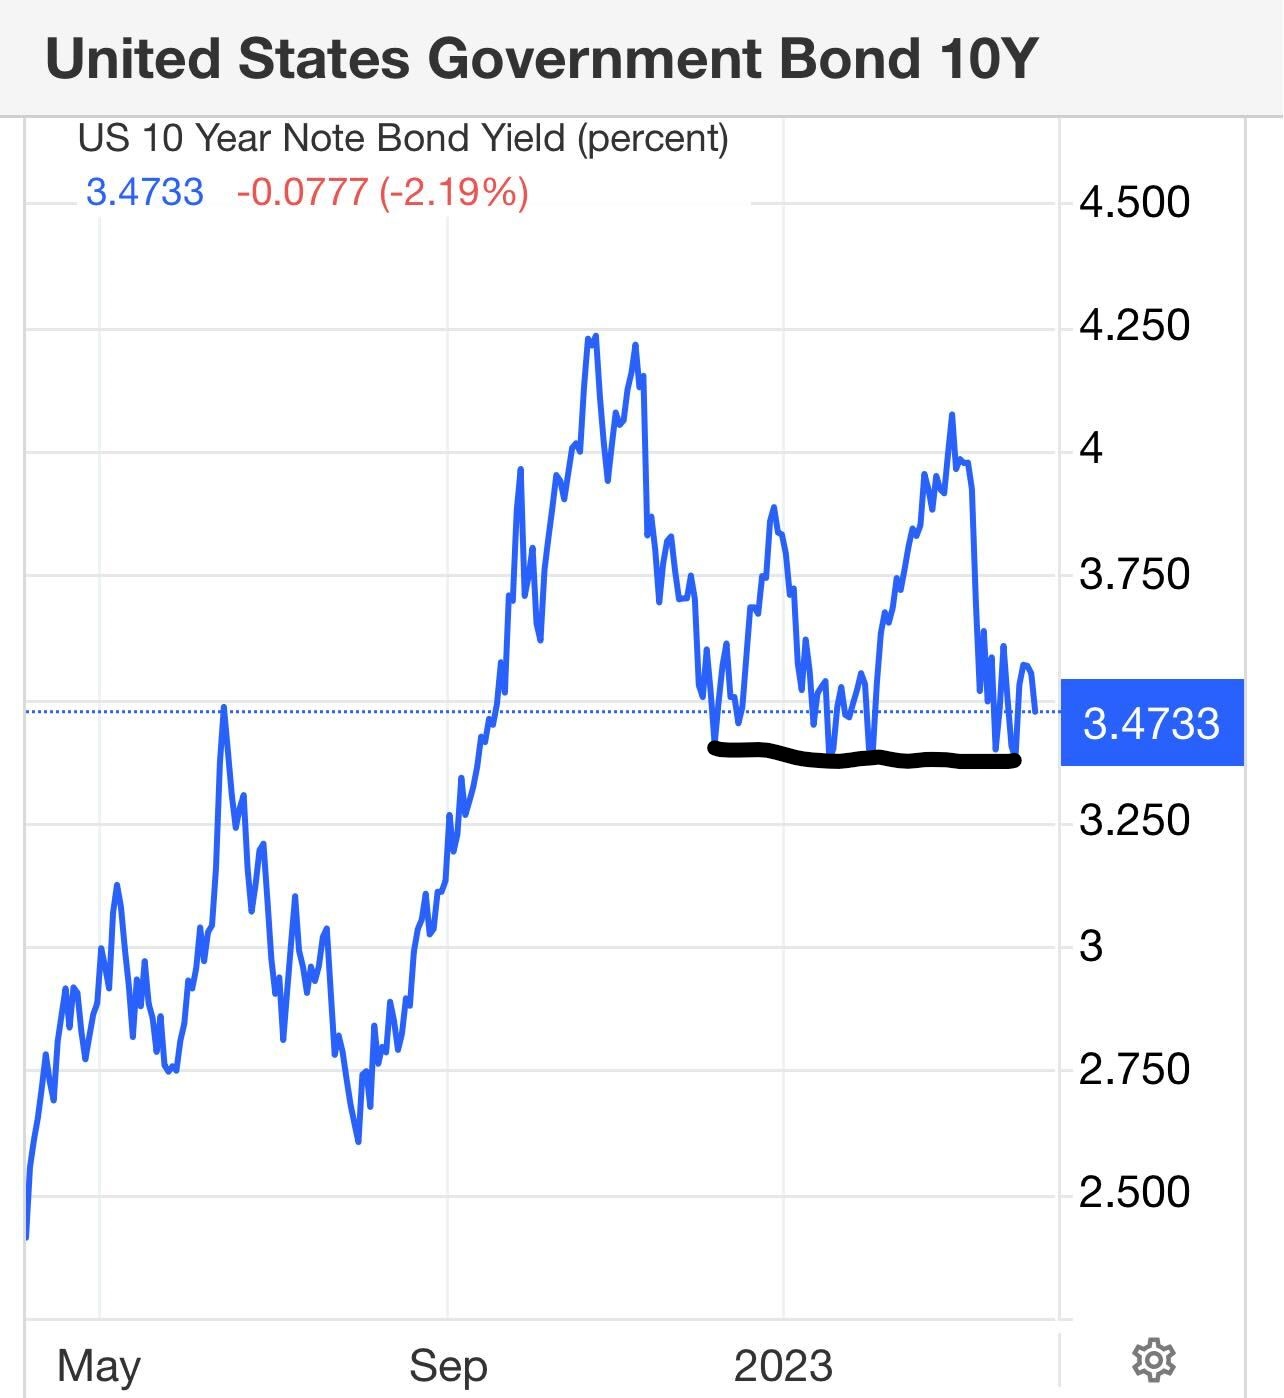
The chart below shows how the weekly 10-year yield ended with lower bond yields. This is important because we previously saw more aggressive moves higher with the 10-year yield, which pushed mortgage rates much higher very quickly. That didn’t happen last week, which means we are more anchored in a lower level for now. In fact, I wouldn’t be shocked if the 10-year yield tried to break below the Gandalf line again this week.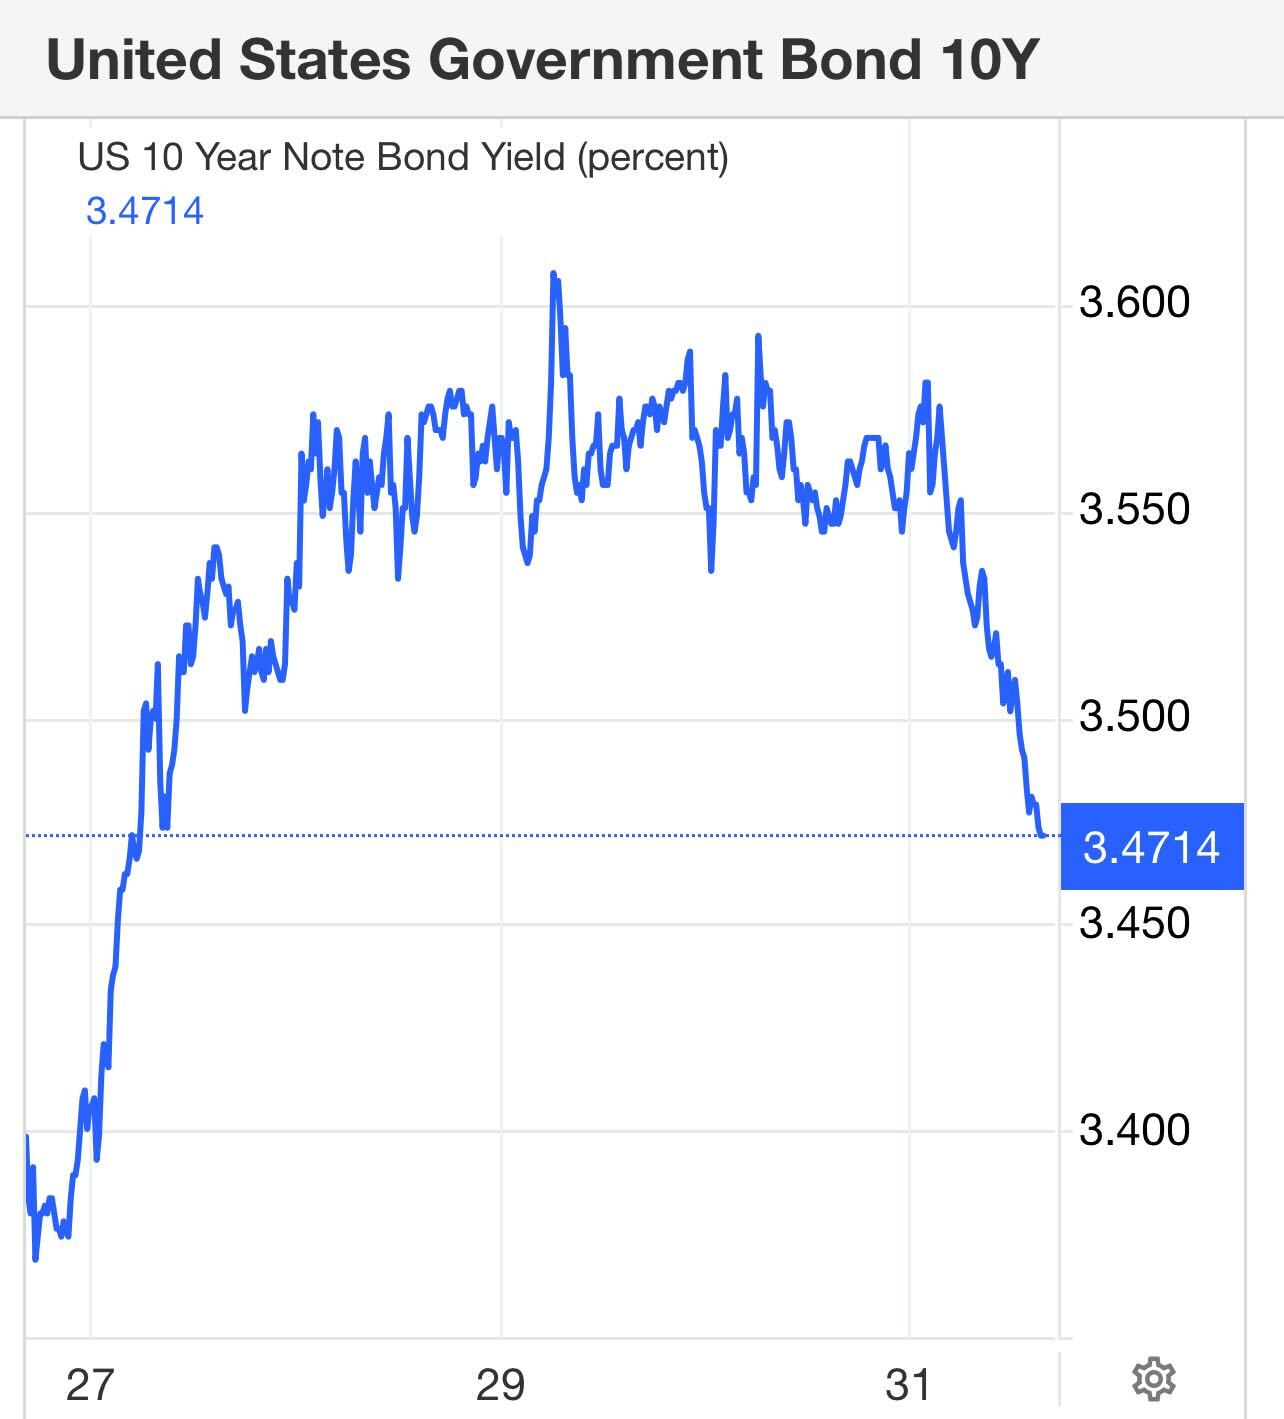
Mortgage rates started last week at 6.38%, got as high as 6.61%, and ended at 6.57%, which seems high versus the 10-year yield. The banking crisis has stressed the mortgage backed securities market, pushing rates higher than usual. In this article I talked about how to look at housing credit getting tighter during the next recession.
Last week had the potential for fireworks, but it was pretty tame, this week we have four labor market reports to deal with.
Weekly housing inventory
Looking at the Altos Research data from last week, the big question is whether we are finally starting to see the seasonal spring increase in inventory. The answer is no, because active listings fell to a new low last week for 2023, so we have to wait and see if April will be the month.
- Weekly inventory change (March 24-March 31): Fell from 413,169 to 410,028
- Same week last year (March 25-April 1st ): Rose from 251,522 to 252,820
- The bottom for 2022 was 240,194
As you can see in the chart below, we are far from what a normal inventory channel looks like, and it’s been hard getting inventory back to pre-COVID-19 levels.
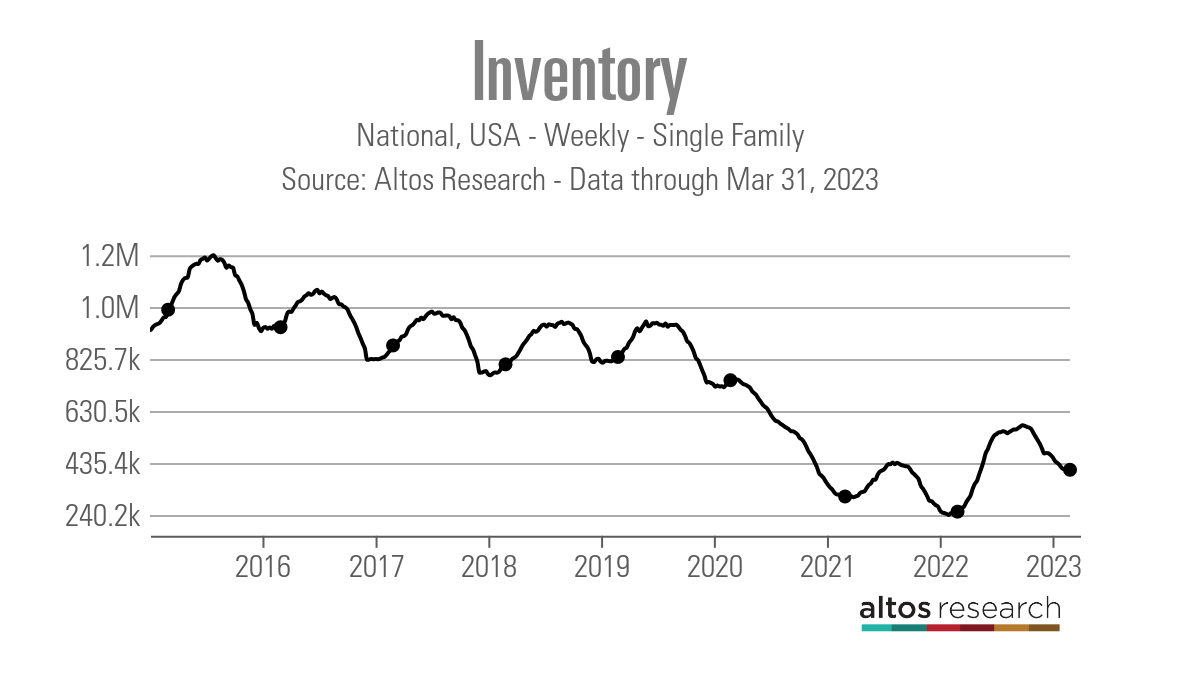
Last year, the weekly seasonal inventory bottom was set on March 4; we still need to confirm the weekly bottom in 2023. It looks similar to 2021 data, which bottomed on April 9. So April will be very telling on the weekly housing inventory with Altos Research.
The NAR data going back decades shows how difficult it’s been to get back to anything normal on the active listing side. In 2007, when sales were down big, total active listings peaked at over 4 million. Today, even though sales were trending at 2007 levels, we are at 980,000 total active listings per the last existing home sales. Inventory is incredibly tight.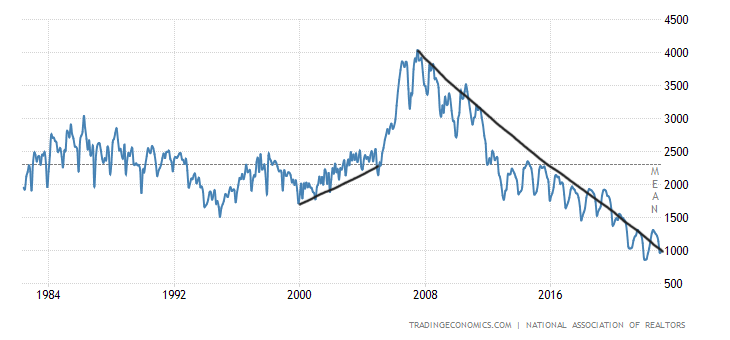
New listing data fell last week and is still trending at all-time lows in 2023. This trend of lower new listing growth has been here for some time with no significant reversal in the data line. Unlike 2021-2022, which were trending similarly year over year, the last few weeks in 2023 have created a noticeable gap, as the chart below shows.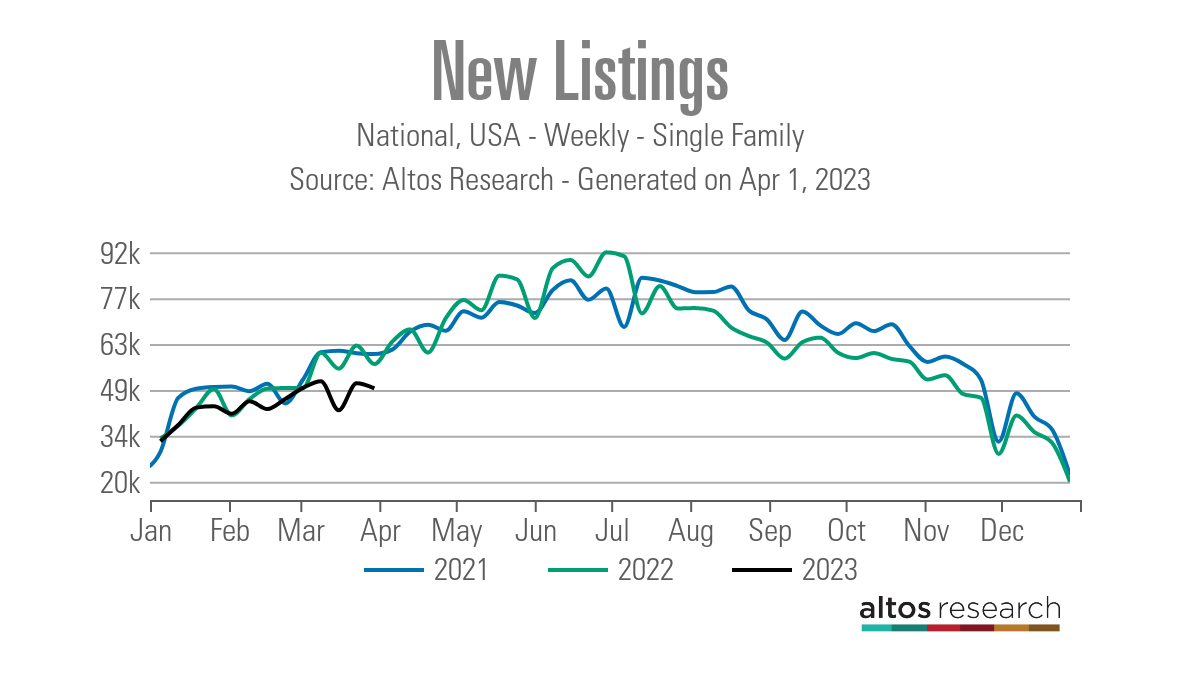
Here are some weekly numbers for you to see the difference in new listings:
- 2021: 59,908
- 2022: 56,774
- 2023: 49,234
Compare those to previous years:
- 2015: 79,706
- 2016: 70,141
- 2017: 87,639
As you can see from the data above, homeowners aren’t rushing to sell because, as I have always talked about, primary residence homeowners don’t act like leveraged stock traders, nor are they are afraid of life like the crazy housing crash YouTube people. That unwillingness to sell hampers inventory even further.
Purchase application data
One of the most improved housing market data lines since Nov. 9, 2022, is purchase application data. This explains why the most recent existing home sales report had one of the most significant month-to-month sales prints ever. We have had three consecutive rising pending home sales reports as well.
Purchase application data was up +2% week to week in the fourth straight week of gains. The index was down -35% year over year, which is a reminder that the year-over-year comps will get easier, especially in the second half of the year.
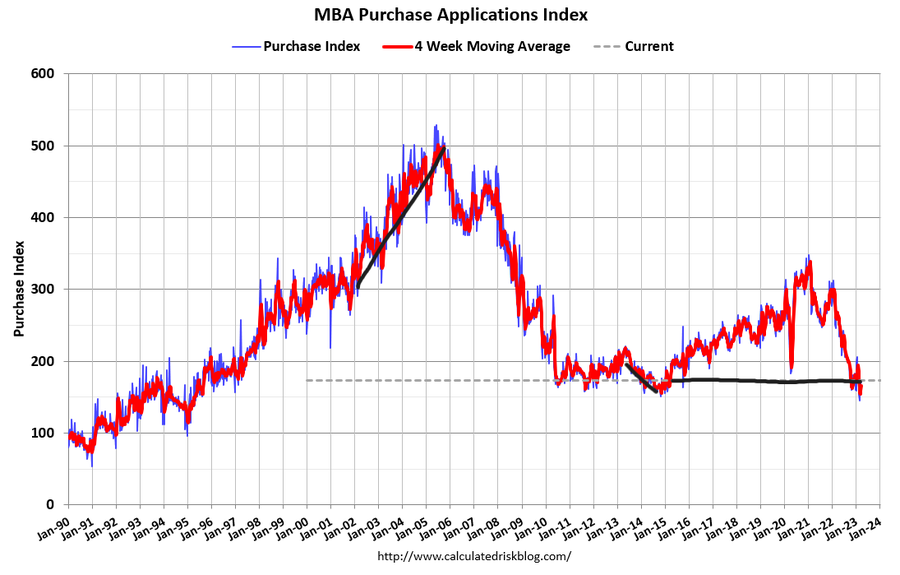
The purchase application data reports have been wild when mortgage rates have gone up or down. Traditionally, we wouldn’t have this volatility in this data line but 2022 was a historic dive. When mortgage rates went from 5.99% to 7.10%, we had three negative prints, bringing this index to levels last seen in 1995. However, we have stabilized the data with four straight weeks of positive prints.
Remember, this data line looks out 30-90 days before it hits the sales data. Also, the seasonality of this data line is almost over. I typically put more weight on this data line from the second week of January to the first week of May, since traditionally total volumes always fall after May.
We have had some odd economic data in housing due to COVID-19 and the rate shocks that have facilitated some crazy moves. However, history has been steady with the seasonality of purchase apps before all this drama, and hopefully, we will get back to normal sooner than later.
The week ahead
Jobs, jobs and more jobs data! We have four jobs reports coming up this week: JOLTS data, ADP jobs report, weekly jobless claims, and jobs Friday as well. If we have any softening in the jobs data and wage growth, that will be better for mortgage rates.
Last week, I was on CNBC talking about how the Federal Reserve‘s focus on creating a job-loss recession isn’t the most effective way of dealing with inflation. They need to endure at this stage because we have seen the growth rate of inflation fall and wage growth cool down — all with a labor market still tight. The Fed trying to force a job-loss recession to make their job easier because they believe it’s the 1970s again isn’t an effective policy since we aren’t in a 1970s economy.
Also, over the weekend, OPEC announced a production cut, sending oil prices higher Sunday evening and the 10-year yield higher by a few basis points. Already Monday morning, with a weaker manufacturing economic report print, the 10-year yield is once again testing the key level.
The Fed can limit the damage of the recent banking crisis and keep the economy expanding rather than force millions of people to the unemployment line. We will have a nice batch of labor data this week to see where we are today with the state of the U.S. economy.
Logan Mohtashami is a housing data analyst, financial writer, and blogger covering the U.S. economy specializing in the housing market. Logan is also a Lead Analyst for HousingWire. Mohtashami has been an invited speaker at the Americatlyst, the California Association Of Realtors, and many other economic conferences. Logan Mohtashami, now retired, has been called a social media star by National Mortgage News and “the chart guy.” Mohtashami’s astute analysis of economic data and years of direct lending experience allows him to present a unique, informed, and unbiased perspective on the financial markets.