CALCULATEDRISK
By Bill McBride
First, from Reuters: D.R. Horton cuts 2025 revenue forecast on weak demand for homes
U.S. homebuilder D.R. Horton lowered its full-year revenue forecast and missed second-quarter profit and revenue estimates on Thursday due to weak demand for homes. … It sees about 85,000 to 87,000 transaction closings from homebuilding operations, down from its earlier forecast of 90,000 to 92,000 homes.
I discussed weaker demand and higher costs last month in Policy and 2025 Housing Outlook
Housing Starts Decreased to 1.324 million Annual Rate in March
From the Census Bureau: Permits, Starts and Completions
Housing Starts:
Privately-owned housing starts in March were at a seasonally adjusted annual rate of 1,324,000. This is 11.4 percent below the revised February estimate of 1,494,000, but is 1.9 percent above the March 2024 rate of 1,299,000. Single-family housing starts in March were at a rate of 940,000; this is 14.2 percent below the revised February figure of 1,096,000. The March rate for units in buildings with five units or more was 371,000.
Building Permits:
Privately-owned housing units authorized by building permits in March were at a seasonally adjusted annual rate of 1,482,000. This is 1.6 percent above the revised February rate of 1,459,000, but is 0.2 percent below the March 2024 rate of 1,485,000. Single-family authorizations in March were at a rate of 978,000; this is 2.0 percent below the revised February figure of 998,000. Authorizations of units in buildings with five units or more were at a rate of 445,000 in March.
emphasis added
The first graph shows single and multi-family housing starts since 2000 (including housing bubble).
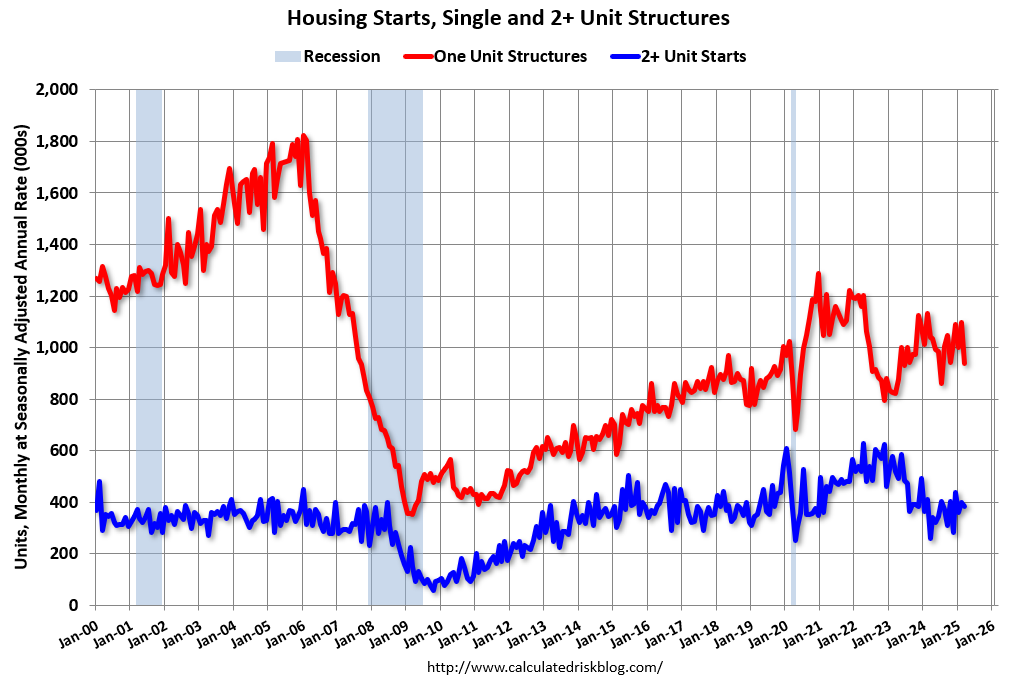
Multi-family starts (blue, 2+ units) decreased month-over-month in March. Multi-family starts were up sharply year-over-year (March 2024 was very weak for multi-family). Single-family starts (red) decreased in March and were down 9.7% year-over-year.
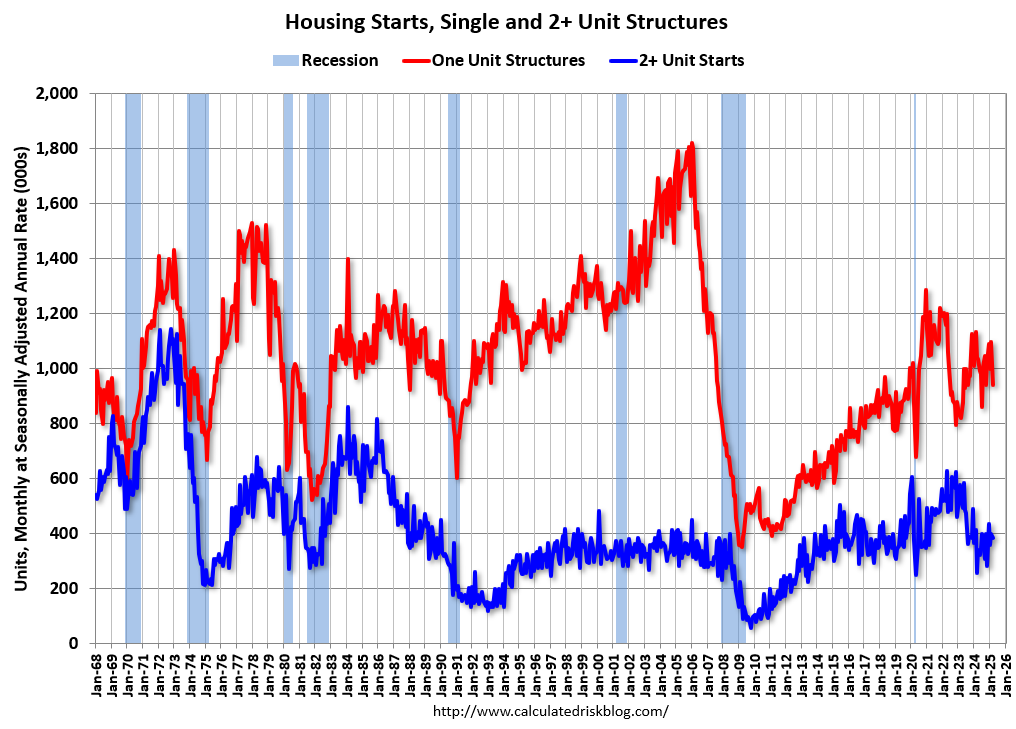
The second graph shows single and multi-family starts since 1968. This shows the huge collapse following the housing bubble, and then the eventual recovery – and the pandemic related volatility.
Total housing starts in March were well below expectations; however, starts in January and February were revised up slightly, combined.
The third graph shows the month-to-month comparison for total starts between 2024 (blue) and 2025 (red).
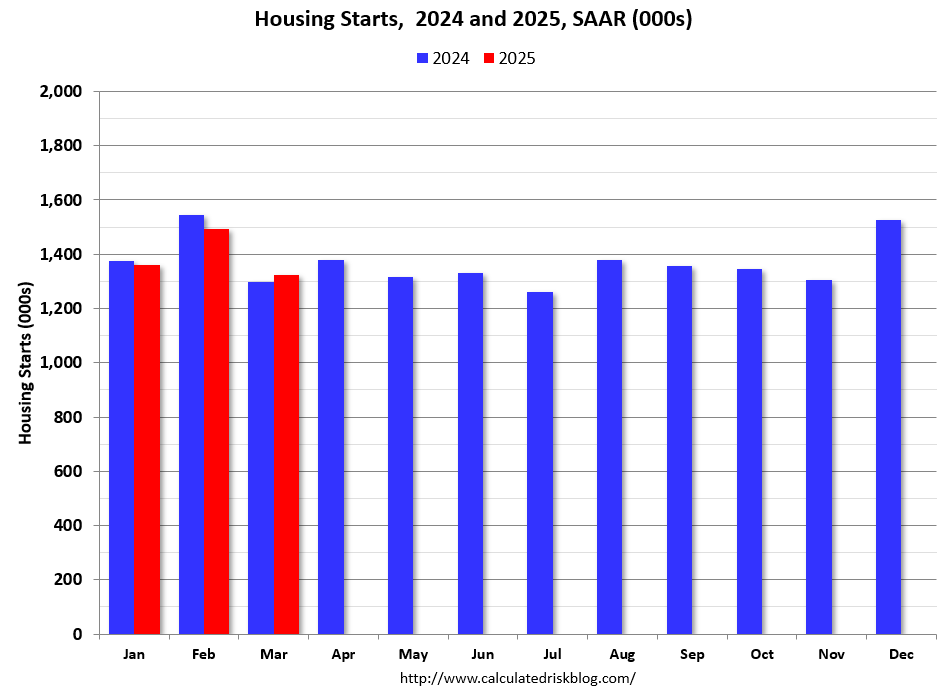
Total starts were up 1.9% in March compared to March 2024. Year-to-date (YTD) starts are down 1.5% compared to the same period in 2024. Single family starts are down 5.6% YTD and multi-family up 9.0% YTD.
Multi-Family Housing Units Under Construction Remains Elevated
The fourth graph shows housing starts under construction, Seasonally Adjusted (SA)
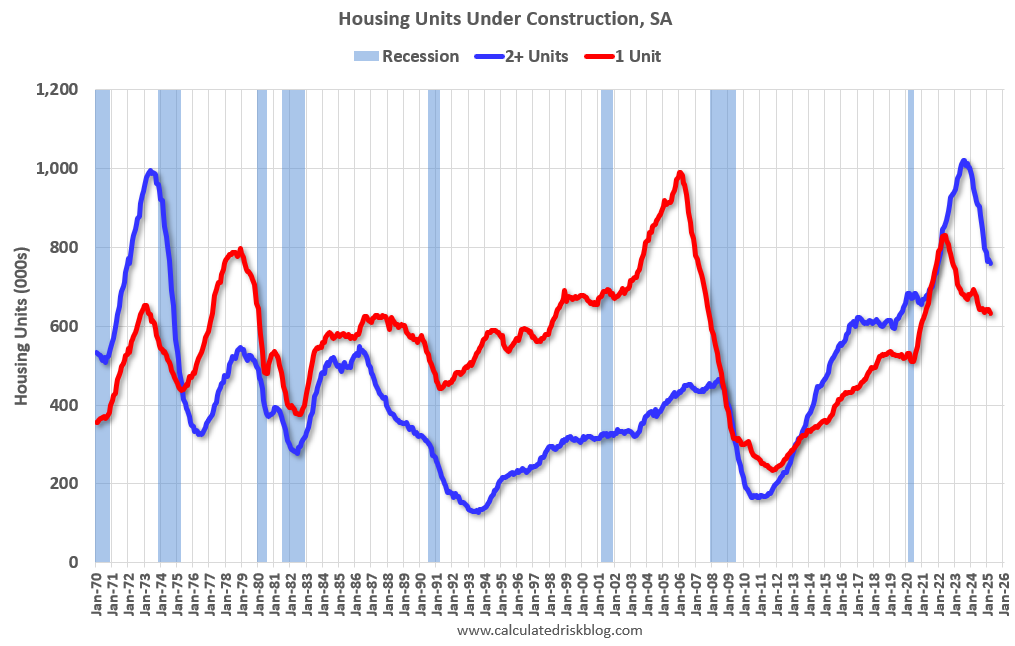
Currently there are 632 thousand single family units (red) under construction (SA). This was down in March compared to February, and 198 thousand below the pandemic peak in May 2022. Single family units under construction peaked in 2022 as supply chain constraints eased.
Currently there are 759 thousand multi-family units (blue) under construction. This was down from 768 thousand in February. This is 262 thousand below the record set in July 2023 of 1,021 thousand. For multi-family, construction delays had been a significant factor, but multi-family units under construction have peaked and declined significantly in 2024 – and will decline further in 2025.
Combined, there are 1.391 million units under construction, 320 thousand below the all-time record of 1.711 million set in October 2022.
In the three years prior to the pandemic, there were about 1.1 to 1.2 million housing units under construction – so the current level is still historically high. And there will likely be a decline in demand in 2025 (see the Horton news today).
Comparing Starts and Completions
Below is a graph comparing multi-family starts and completions. Since it usually takes over a year on average to complete a multi-family project, there is a lag between multi-family starts and completions. Completions are important because that is new supply added to the market and starts are important because that is future new supply (units under construction is also important for employment).
These graphs use a 12-month rolling total for NSA starts and completions.
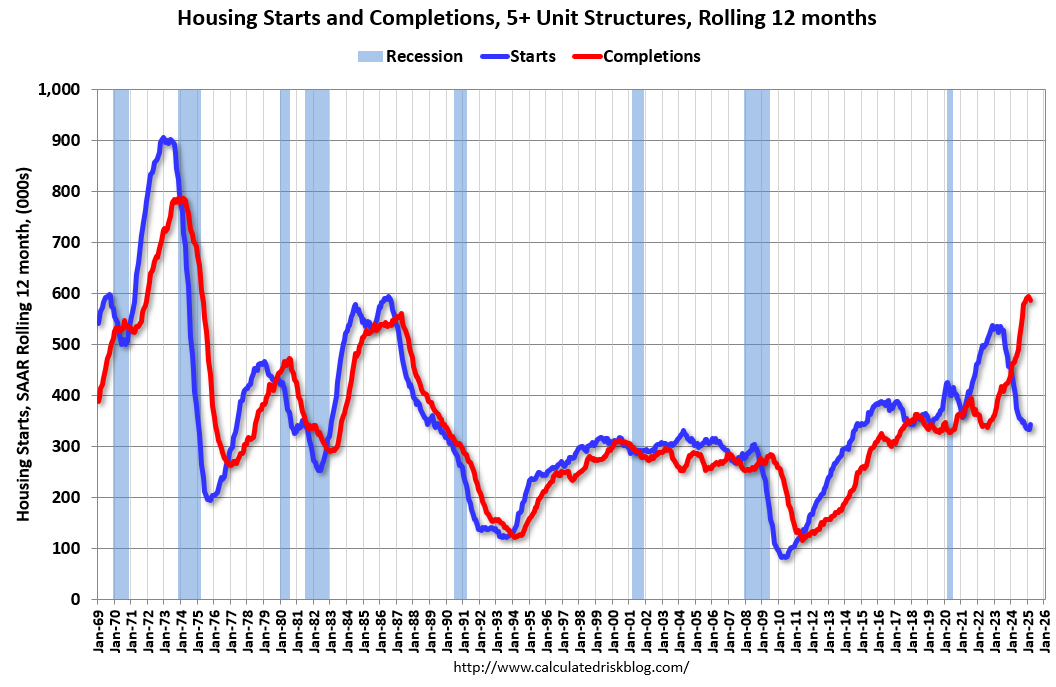
The blue line is for multifamily starts and the red line is for multifamily completions. Builders are now completing many more multifamily housing units than they are starting on a 12-month basis. Multifamily starts might have bottomed on a rolling 12-month basis, and completions might have topped.
The last graph shows single family starts and completions. It usually only takes about 6 months between starting a single-family home and completion – so the lines are much closer than for multi-family. The blue line is for single family starts and the red line is for single family completions.
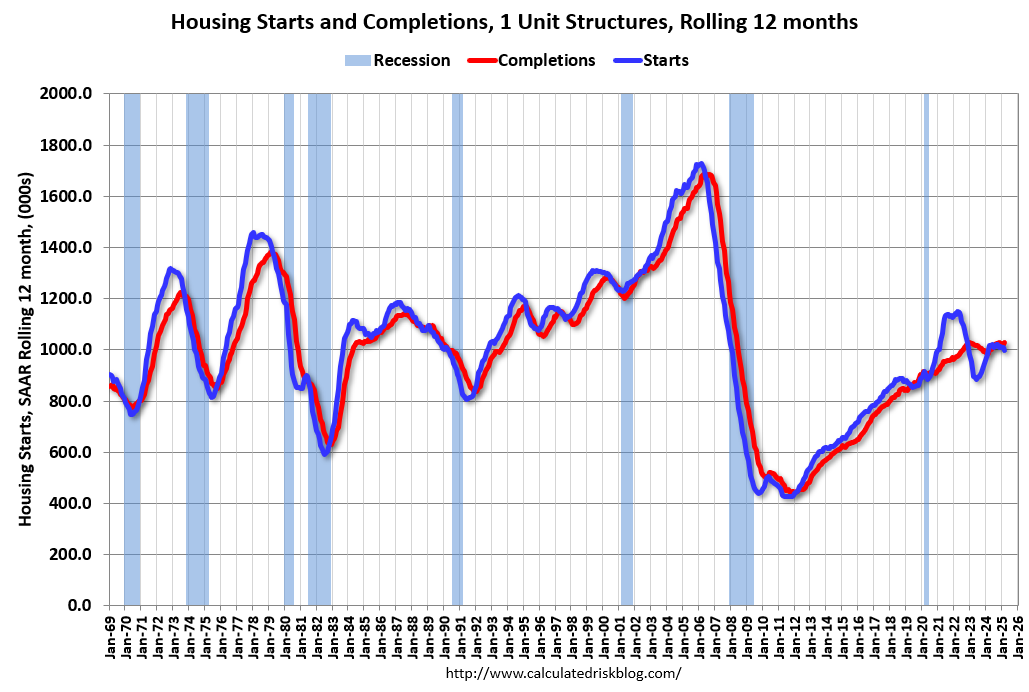
Builders are now starting about the same number of single-family homes as they are completing on a 12-month basis.
Conclusions
Total housing starts in March were well below expectations; however, starts in January and February were revised up slightly, combined. Note that permits were stronger than starts in March.
It appears demand is weakening due to policy, and this will push down starts in 2025.
For multi-family, I’ve been watching leading indicators, such as the National Multifamily Housing Council’s (NMHC’s) Quarterly Survey of Apartment Market Conditions (“Looser market conditions for the tenth consecutive quarter” in January) and the Architectural Billings Index (ABI) for signs of a pickup in the multi-family sector. The ABI for multi-family “remained negative and has been negative for the last 31 months.” This suggests we will see some further weakness in multi-family starts in 2025.
For single family starts, yesterday the NAHB reported:
“The recent dip in mortgage rates may have pushed some buyers off the fence in March, helping builders with sales activity,” said NAHB Chairman Buddy Hughes, a home builder and developer from Lexington, N.C. “At the same time, builders have expressed growing uncertainty over market conditions as tariffs have increased price volatility for building materials at a time when the industry continues to grapple with labor shortages and a lack of buildable lots.”
“Policy uncertainty is having a negative impact on home builders, making it difficult for them to accurately price homes and make critical business decisions,” said NAHB Chief Economist Robert Dietz. “The April HMI data indicates that the tariff cost effect is already taking hold, with the majority of builders reporting cost increases on building materials due to tariffs.” emphasis added
Policy will negatively impact single family starts in 2025.