CALCULATEDRISK
By Bill McBride
From the Census Bureau: Permits, Starts and Completions
Housing Starts:
Privately-owned housing starts in June were at a seasonally adjusted annual rate of 1,321,000. This is 4.6 percent above the revised May estimate of 1,263,000, but is 0.5 percent below the June 2024 rate of 1,327,000. Single-family housing starts in June were at a rate of 883,000; this is 4.6 percent below the revised May figure of 926,000. The June rate for units in buildings with five units or more was 414,000.
Building Permits:
Privately-owned housing units authorized by building permits in June were at a seasonally adjusted annual rate of 1,397,000. This is 0.2 percent above the revised May rate of 1,394,000, but is 4.4 percent below the June 2024 rate of 1,461,000. Single-family authorizations in June were at a rate of 866,000; this is 3.7 percent below the revised May figure of 899,000. Authorizations of units in buildings with five units or more were at a rate of 478,000 in June.
emphasis added
The first graph shows single and multi-family housing starts since 2000 (including housing bubble).
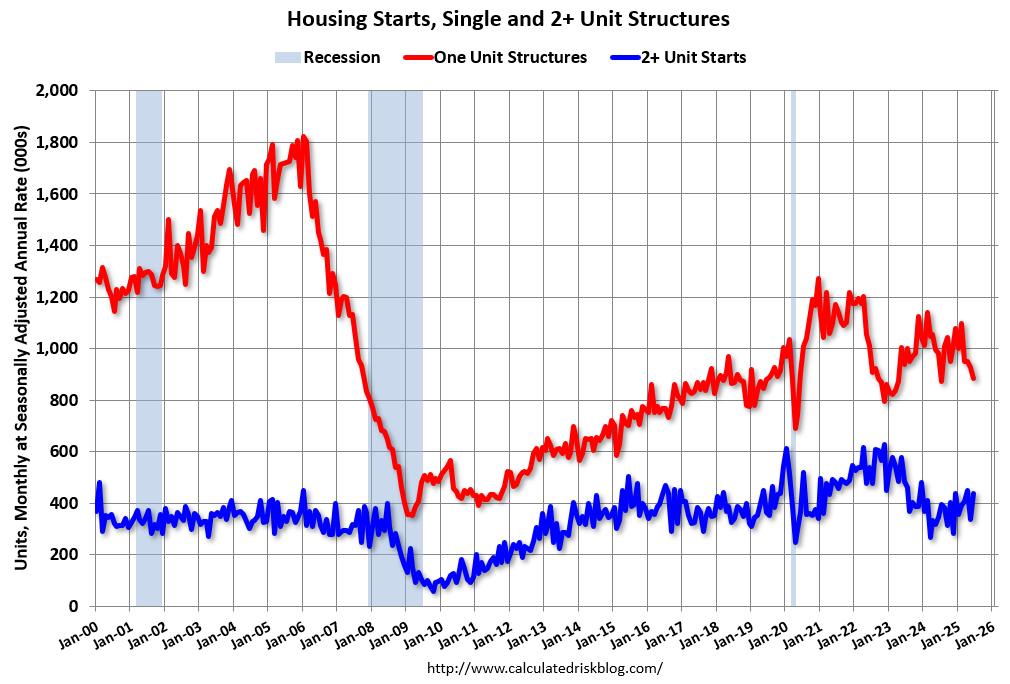
Multi-family starts (blue, 2+ units) increased sharply month-over-month in June. Multi-family starts were up 26.6% year-over-year. Single-family starts (red) decreased in June and were down 10.0% year-over-year.
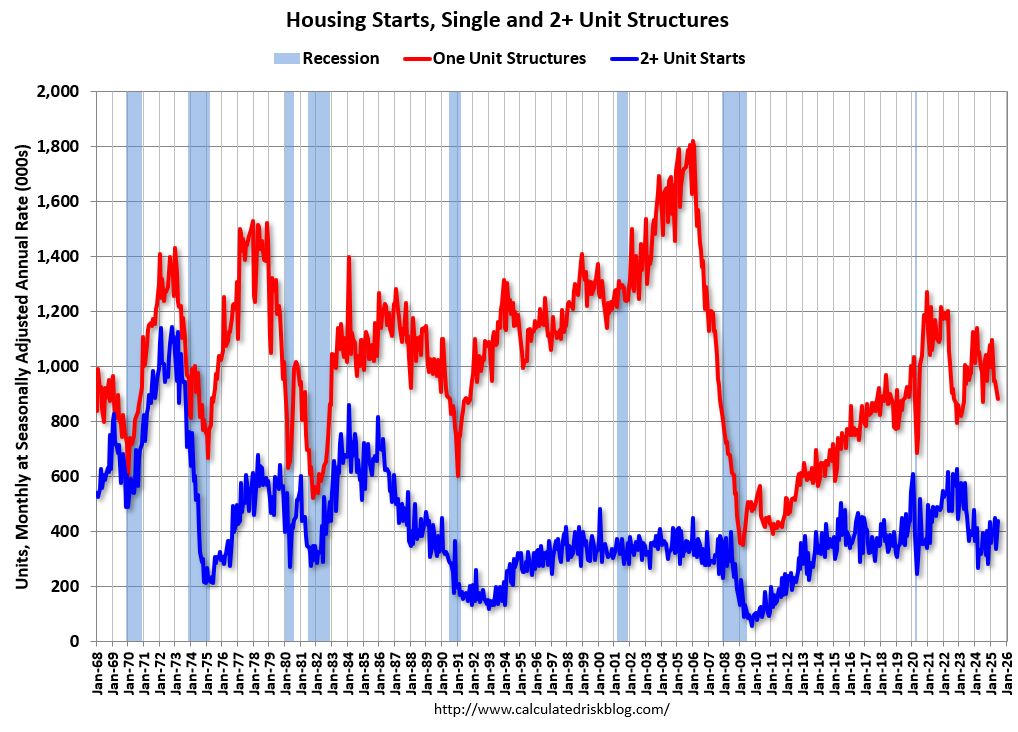
The second graph shows single and multi-family starts since 1968.
Total housing starts in June were above expectations (due to volatile multi-family sector) and starts in April and May were revised up.
The third graph shows the month-to-month comparison for total starts between 2024 (blue) and 2025 (red).
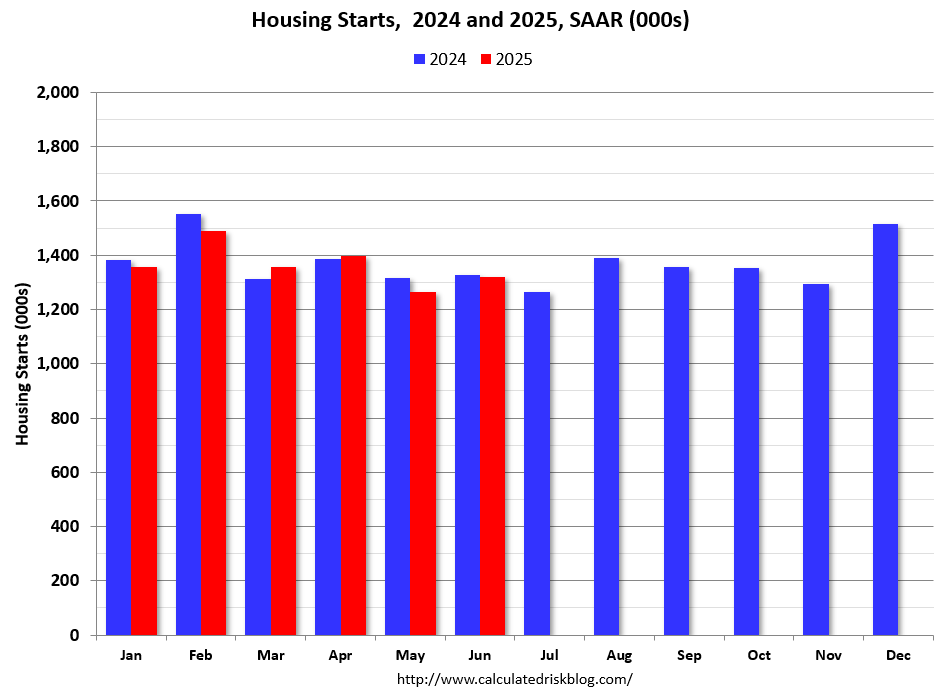
Total starts were down 0.5% in June compared to June 2024. Year-to-date (YTD) starts are down 1.0% compared to the same period in 2024. Single family starts are down 6.9% YTD and multi-family up 15.7% YTD.
Multi-Family Housing Units Under Construction Remains Elevated
The fourth graph shows housing starts under construction, Seasonally Adjusted (SA).
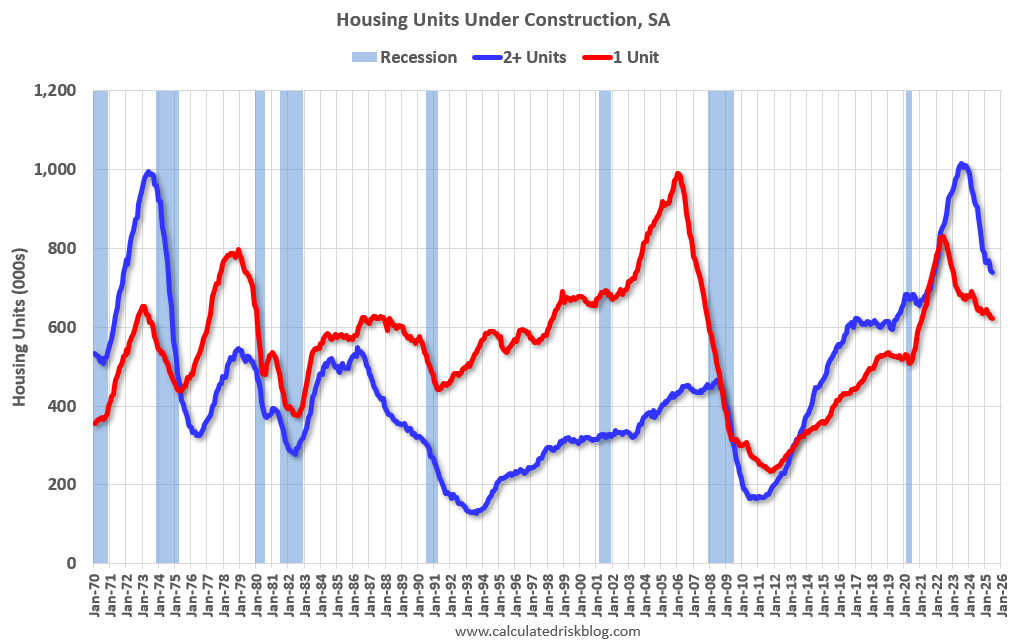
Currently there are 622 thousand single family units (red) under construction (SA). This was down in June compared to May, and 208 thousand below the pandemic peak in June 2022. Single family units under construction peaked in 2022 as supply chain constraints eased.
Currently there are 739 thousand multi-family units (blue) under construction. This was down from 743 thousand in May. This is 277 thousand below the record set in July 2023 of 1,016 thousand. For multi-family, construction delays had been a significant factor, but multi-family units under construction have peaked and declined significantly in 2024 – and will decline further in 2025.
Combined, there are 1.361 million units under construction, 354 thousand below the all-time record of 1.715 million set in October 2022.
In the three years prior to the pandemic, there were about 1.1 to 1.2 million housing units under construction – so the current level is still historically high.
Comparing Starts and Completions
Below is a graph comparing multi-family starts and completions. Since it usually takes over a year on average to complete a multi-family project, there is a lag between multi-family starts and completions. Completions are important because that is new supply added to the market and starts are important because that is future new supply (units under construction is also important for employment).
These graphs use a 12-month rolling total for NSA starts and completions.
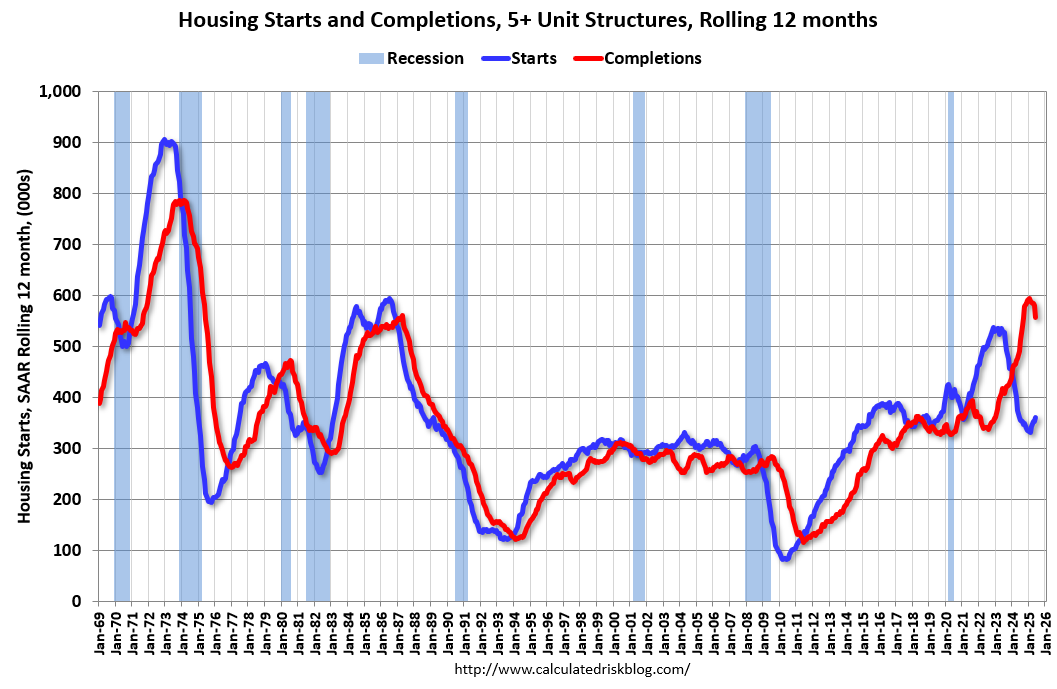
The blue line is for multifamily starts and the red line is for multifamily completions. Builders have been completing many more multifamily housing units than they have started on a 12-month basis. Multifamily starts might have bottomed on a rolling 12-month basis, and completions have topped.
The last graph shows single family starts and completions. It usually only takes about 6 months between starting a single-family home and completion – so the lines are much closer than for multi-family. The blue line is for single family starts and the red line is for single family completions.
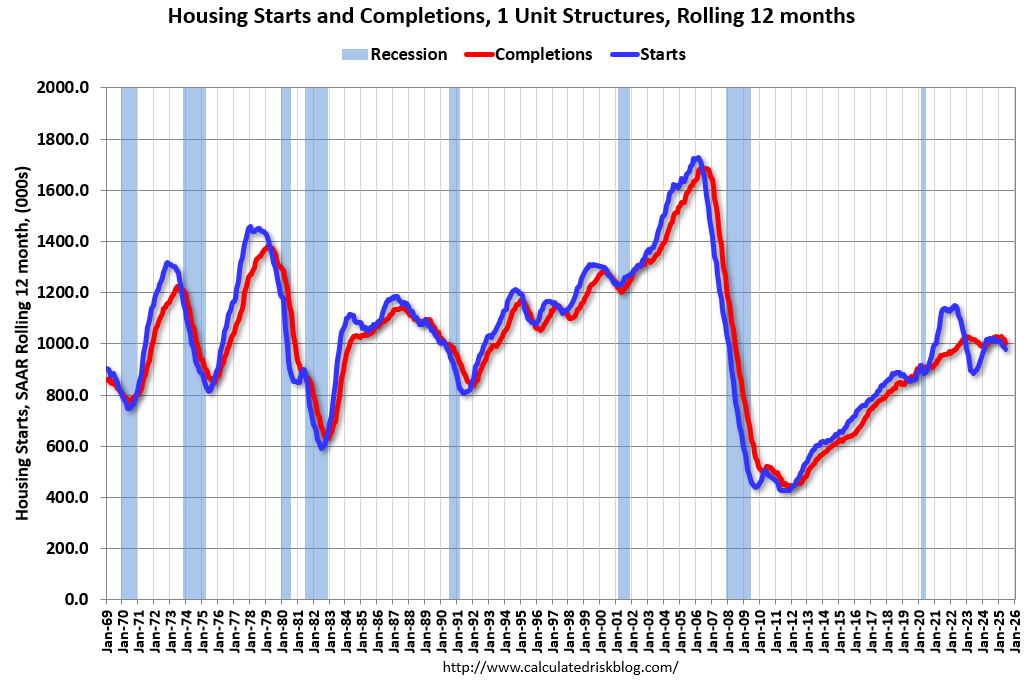
Builders are now starting about the same number of single-family homes as they are completing on a 12-month basis. Both starts and completions are trending down.
Conclusions
Total housing starts in June were above expectations and starts in April and May were revised up. It was the volatile multi-family sector that pushed up starts in June.
It appears demand is weakening due to policy, and this will hold down starts in 2025.
For multi-family, I’ve been watching leading indicators, such as the National Multifamily Housing Council’s (NMHC’s) Quarterly Survey of Apartment Market Conditions and the Architectural Billings Index (ABI) for signs of a pickup in the multi-family sector. The ABI for multi-family has been negative for the last 34 months. This suggests the recent pickup in multi-family starts not last.
For single family starts, yesterday the NAHB reported:
the latest HMI survey also revealed that 38% of builders reported cutting prices in July, the highest percentage since NAHB began tracking this figure on a monthly basis in 2022. …
“Single-family housing starts will post a decline in 2025 due to ongoing housing affordability challenges,” said NAHB Chief Economist Robert Dietz. “Single-family permits are down 6% on a year-to-date basis and builder traffic in the HMI is at a more than two-year low.”
Policy will likely negatively impact single family starts this year.