CALCULATEDRISK
By Bill McBride
From the Census Bureau: Permits, Starts and Completions
Housing Starts:
Privately-owned housing starts in July were at a seasonally adjusted annual rate of 1,428,000. This is 5.2 percent above the revised June estimate of 1,358,000 and is 12.9 percent above the July 2024 rate of 1,265,000. Single-family housing starts in July were at a rate of 939,000; this is 2.8 percent above the revised June figure of 913,000. The July rate for units in buildings with five units or more was 470,000.
Building Permits:
Privately-owned housing units authorized by building permits in July were at a seasonally adjusted annual rate of 1,354,000. This is 2.8 percent below the revised June rate of 1,393,000 and is 5.7 percent below the July 2024 rate of 1,436,000. Single-family authorizations in July were at a rate of 870,000; this is 0.5 percent above the revised June figure of 866,000. Authorizations of units in buildings with five units or more were at a rate of 430,000 in July.
emphasis added
The first graph shows single and multi-family housing starts since 2000 (including housing bubble).

Multi-family starts (blue, 2+ units) increased month-over-month in July. Multi-family starts were up 24.1% year-over-year. Single-family starts (red) increased in July and were up 7.8% year-over-year.
The second graph shows single and multi-family starts since 1968.

Total housing starts in July were well above expectations and starts in May and June were revised up.
The third graph shows the month-to-month comparison for total starts between 2024 (blue) and 2025 (red).

Total starts were up 12.9% in July compared to July 2024. Note that July was the weakest month in 2024, so this was an easy comparison.
Year-to-date (YTD) starts are up 1.6% compared to the same period in 2024. Single family starts are down 4.2% YTD and multi-family up 18.1% YTD.
Multi-Family Housing Units Under Construction Remains Elevated
The fourth graph shows housing starts under construction, Seasonally Adjusted (SA).
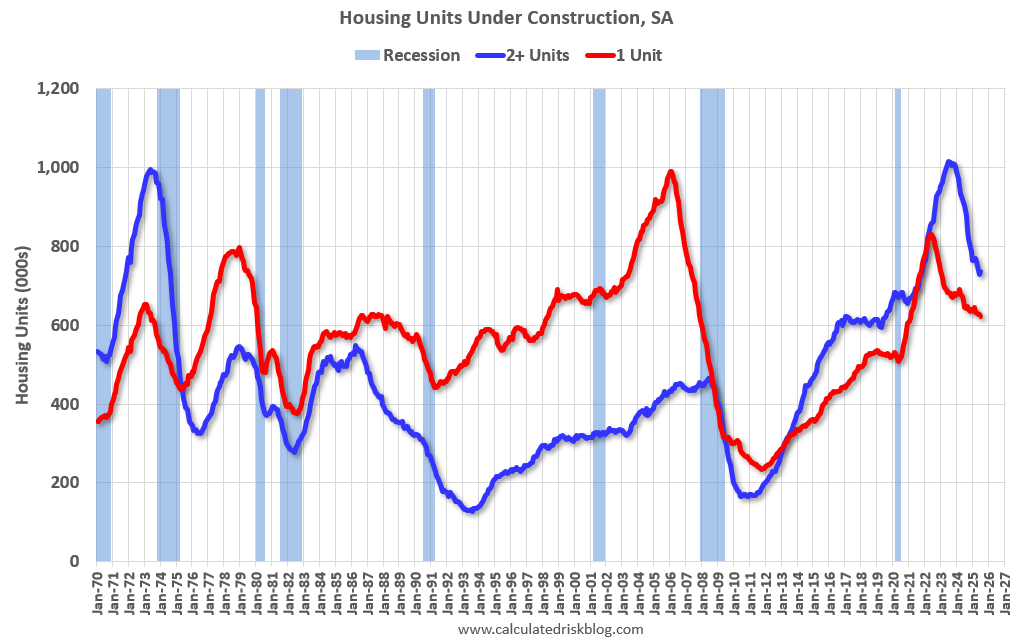
Currently there are 621 thousand single family units (red) under construction (SA). This was down in July compared to June, and 209 thousand below the pandemic peak in June 2022. Single family units under construction peaked in 2022 as supply chain constraints eased.
Currently there are 736 thousand multi-family units (blue) under construction. This was up from 729 thousand in June. This is 280 thousand below the record set in July 2023 of 1,016 thousand. For multi-family, construction delays had been a significant factor, but multi-family units under construction have peaked and declined significantly in 2024 – and will decline further in 2025.
Combined, there are 1.357 million units under construction, 358 thousand below the all-time record of 1.715 million set in October 2022.
In the three years prior to the pandemic, there were about 1.1 to 1.2 million housing units under construction – so the current level is still historically high.
Comparing Starts and Completions
Below is a graph comparing multi-family starts and completions. Since it usually takes over a year on average to complete a multi-family project, there is a lag between multi-family starts and completions. Completions are important because that is new supply added to the market and starts are important because that is future new supply (units under construction is also important for employment).
These graphs use a 12-month rolling total for NSA starts and completions.

The blue line is for multifamily starts and the red line is for multifamily completions. Builders have been completing many more multifamily housing units than they have started on a 12-month basis. Multifamily starts have bottomed on a rolling 12-month basis, and completions have topped.
The last graph shows single family starts and completions. It usually only takes about 6 months between starting a single-family home and completion – so the lines are much closer than for multi-family. The blue line is for single family starts and the red line is for single family completions.

Builders are now starting about the same number of single-family homes as they are completing on a 12-month basis. Both starts and completions are trending down.
Conclusions
Total housing starts in July were well above expectations and starts in May and June were revised up. It was mostly the volatile multi-family sector that pushed up starts in June.
It appears demand is weakening due to policy, and this will hold down single family starts in 2025.
For multi-family, I’ve been watching leading indicators, such as the National Multifamily Housing Council’s (NMHC’s) Quarterly Survey of Apartment Market Conditions and the Architectural Billings Index (ABI) for signs of a pickup in the multi-family sector. The NMHC survey noted that some markets have tightened a little recently.
“Rent growth remains low in the South and West amidst a historic overhang of new supply, even though strong demand has kept absorptions high and occupancy stable,” noted NMHC’s Chief Economist and Senior Director of Research, Chris Bruen. “Meanwhile, tighter apartment conditions persist in the more supply-constrained Northeast and Midwest.”
Meanwhile the ABI for multi-family has been negative for the last 35 months. This suggests the recent pickup in multi-family starts might not last.
For single family starts, yesterday the NAHB reported:
Builder confidence in the market for newly built single-family homes was 32 in August, down one point from July, according to the National Association of Home Builders (NAHB)/Wells Fargo Housing Market Index (HMI) released today. Builder sentiment has now been in negative territory for 16 consecutive months and has hovered at a relatively low reading between 32 and 34 since May.
emphasis added
Policy will likely negatively impact single family starts this year.