CALCULATEDRISK
By Bill McBride
From the Census Bureau: Permits, Starts and Completions
Housing Starts:
Privately-owned housing starts in January were at a seasonally adjusted annual rate of 1,487,000. This is 7.2 percent above the revised December estimate of 1,387,000 and is 9.5 percent above the January 2025 rate of 1,358,000. Single-family housing starts in January were at a rate of 935,000; this is 2.8 percent below the revised December figure of 962,000. The January rate for units in buildings with five units or more was 524,000.
Building Permits:
Privately-owned housing units authorized by building permits in January were at a seasonally adjusted annual rate of 1,376,000. This is 5.4 percent below the revised December rate of 1,455,000 and is 5.8 percent below the January 2025 rate of 1,460,000. Single-family authorizations in January were at a rate of 873,000; this is 0.9 percent below the revised December figure of 881,000. Authorizations of units in buildings with five units or more were at a rate of 453,000 in January.
emphasis added
The first graph shows single and multi-family housing starts since 2000 (including housing bubble).
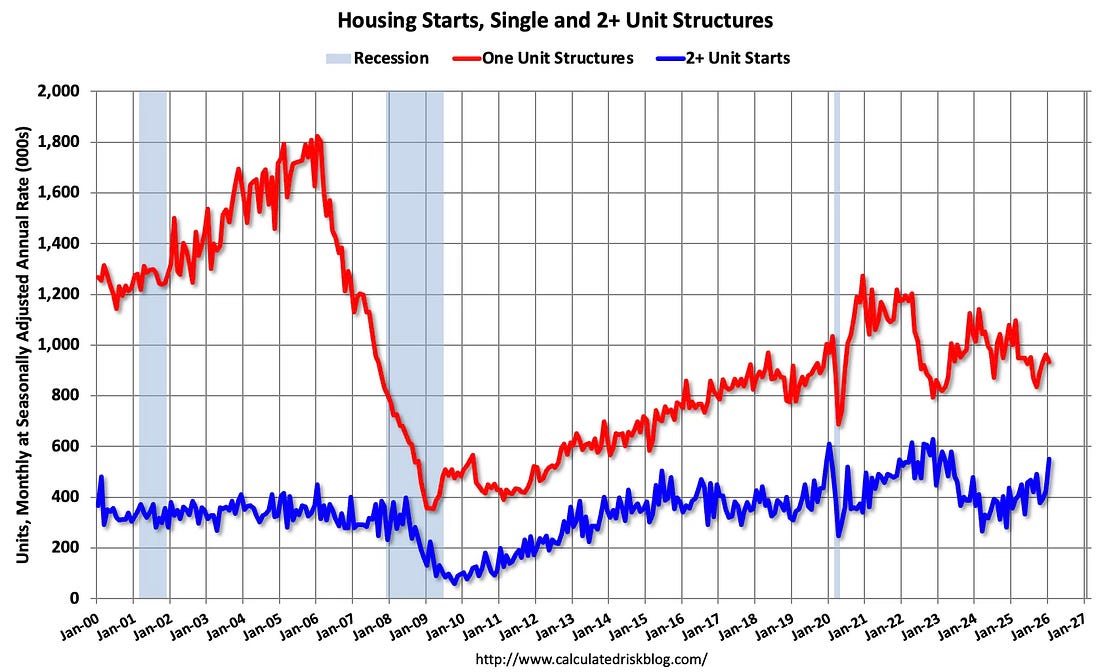
Multi-family starts (blue, 2+ units) increased month-over-month in January. Multi-family starts were up 54% year-over-year in January. Single-family starts (red) decreased in January and were down 6.5% year-over-year.
The second graph shows single and multi-family starts since 1968.
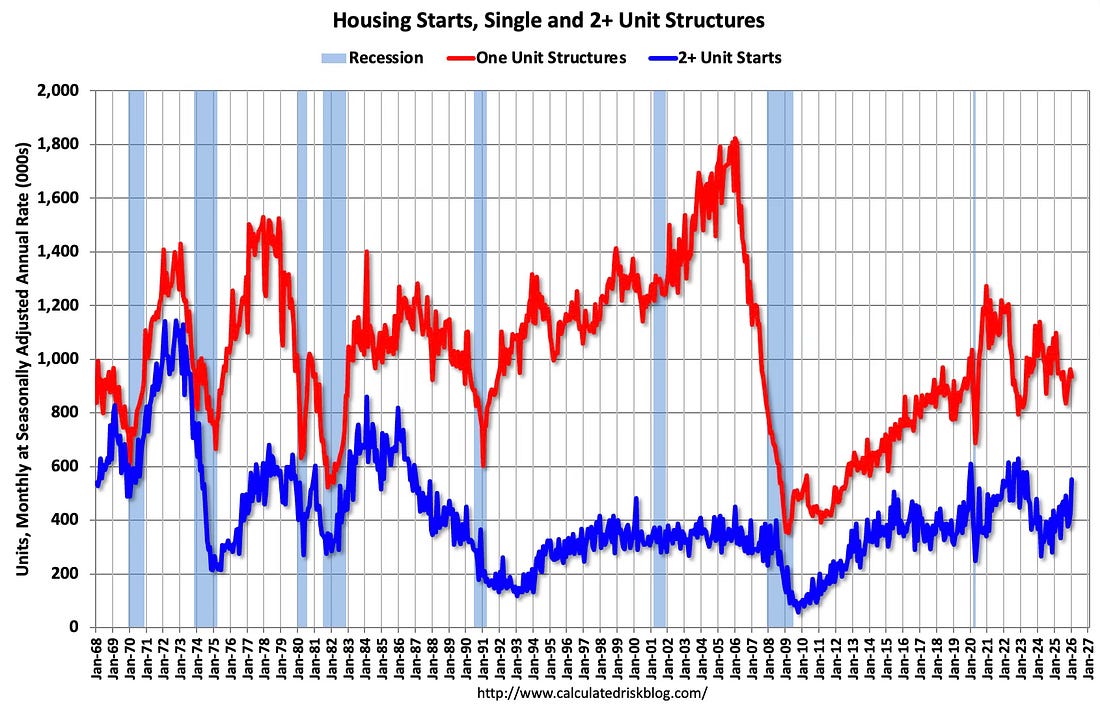
Total housing starts in January were above expectations.
The third graph shows the month-to-month comparison for total starts between 2025 (blue) and 2026 (red).
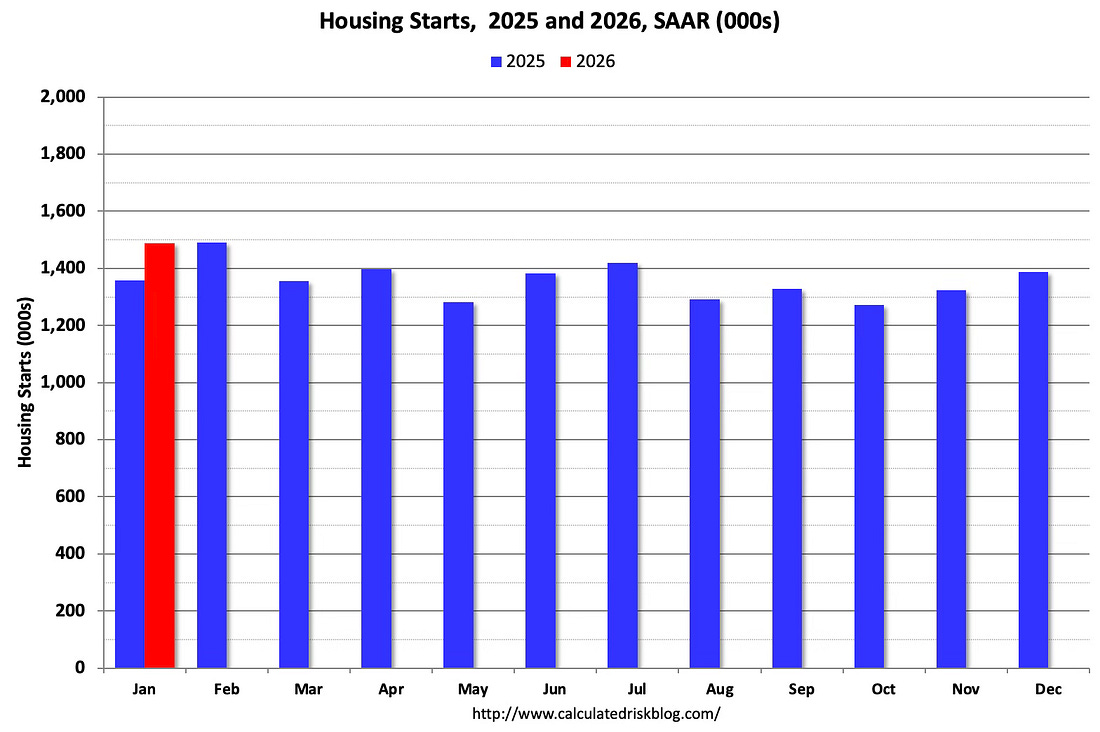
Total starts were up 9.5% in January compared to January 2025 due to the sharp increase in the volatile multi-family starts. It is likely multi-family will decline in the coming months.
Housing Units Under Construction Remains Slightly Elevated
The fourth graph shows housing starts under construction, Seasonally Adjusted (SA).
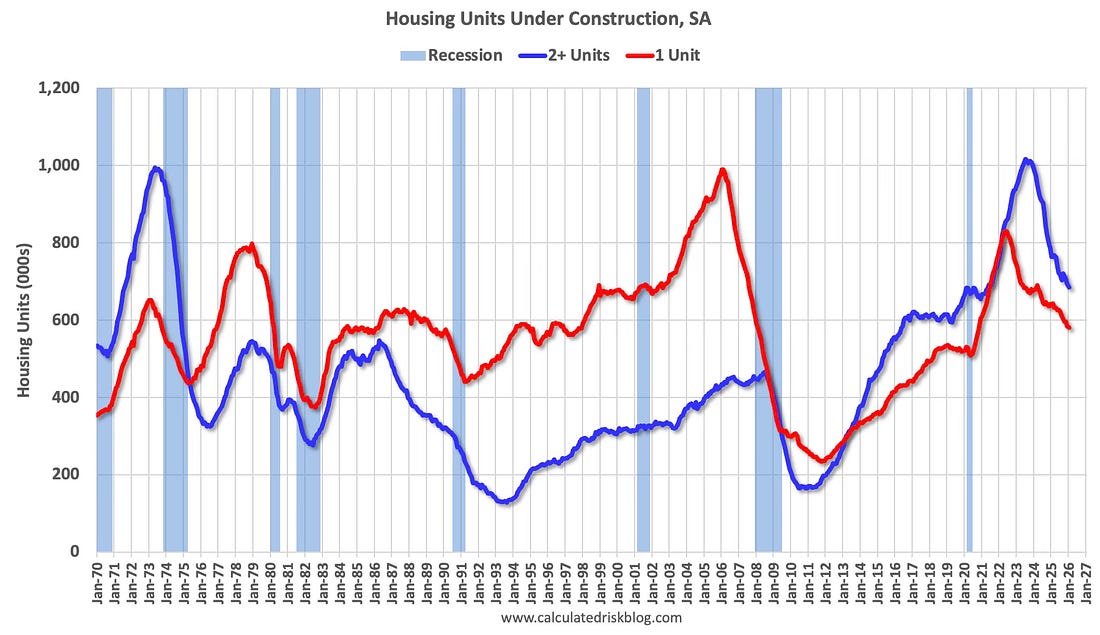
Currently there are 582 thousand single family units (red) under construction (SA). This was down in January compared to December, and 248 thousand below the pandemic peak in June 2022.
Currently there are 686 thousand multi-family units (blue) under construction. This was down from 694 thousand in December. This is 330 thousand below the record set in July 2023 of 1,016 thousand.
Combined, there are 1.268 million units under construction, 447 thousand below the all-time record of 1.715 million set in October 2022.
In the three years prior to the pandemic, there were about 1.1 to 1.2 million housing units under construction – so the current level is still a little elevated.
Comparing Starts and Completions
Below is a graph comparing multi-family starts and completions. Since it usually takes over a year on average to complete a multi-family project, there is a lag between multi-family starts and completions. Completions are important because that is new supply added to the market and starts are important because that is future new supply (units under construction is also important for employment).
These graphs use a 12-month rolling total for NSA starts and completions.
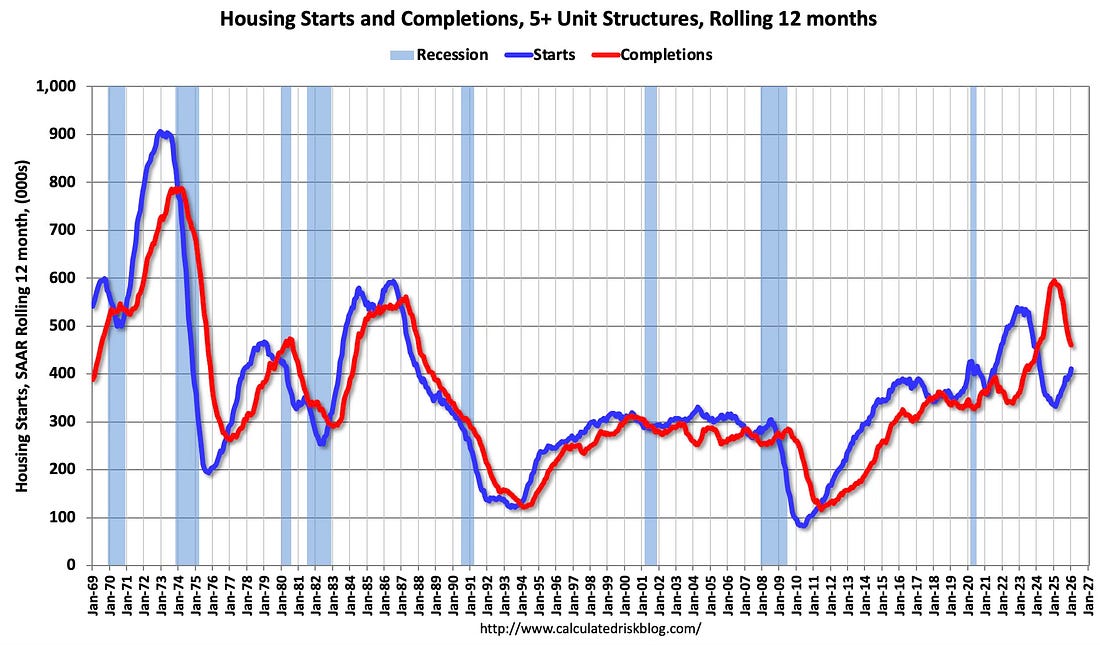
The blue line is for multifamily starts and the red line is for multifamily completions. Builders have been completing more multifamily housing units than they have started on a 12-month basis. Multifamily starts have bottomed on a rolling 12-month basis, and completions have topped.
The last graph shows single family starts and completions. It usually only takes about 6 months between starting a single-family home and completion – so the lines are much closer than for multi-family. The blue line is for single family starts and the red line is for single family completions.
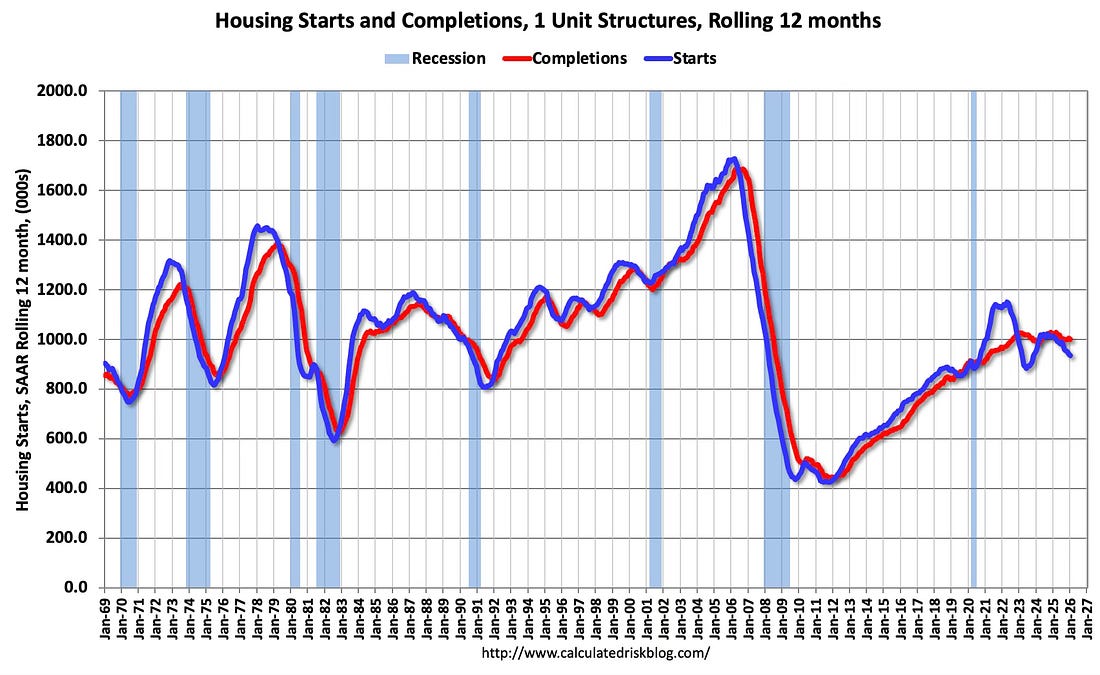
Builders are now completing slightly more single-family homes than they are starting on a 12-month basis. Both starts and completions are trending down.
Total housing starts in January were above expectations due to the surge in multi-family starts.
For multi-family, I’ve been watching leading indicators, such as the National Multifamily Housing Council’s (NMHC’s) Quarterly Survey of Apartment Market Conditions and the Architectural Billings Index (ABI) for signs of a pickup in the multi-family sector. The NMHC noted:
The Market Tightness Index (32) came in below the breakeven level of 50, indicating lower rent growth and higher vacancies for the second consecutive quarter.
Meanwhile the ABI for multi-family has been negative for the last 42 months. This suggests the recent pickup in multi-family starts will not last.