CALCULATEDRISK
By Bill McBride
Length of Time from Start to Completion Declined in 2024
From the Census Bureau: Permits, Starts and Completions
Housing Starts:
Privately-owned housing starts in February were at a seasonally adjusted annual rate of 1,501,000. This is 11.2 percent above the revised January estimate of 1,350,000, but is 2.9 percent below the February 2024 rate of 1,546,000. Single-family housing starts in February were at a rate of 1,108,000; this is 11.4 percent above the revised January figure of 995,000. The February rate for units in buildings with five units or more was 370,000.
Building Permits:
Privately-owned housing units authorized by building permits in February were at a seasonally adjusted annual rate of 1,456,000. This is 1.2 percent below the revised January rate of 1,473,000 and is 6.8 percent below the February 2024 rate of 1,563,000. Single-family authorizations in February were at a rate of 992,000; this is 0.2 percent below the revised January figure of 994,000. Authorizations of units in buildings with five units or more were at a rate of 404,000 in February.
emphasis added
The first graph shows single and multi-family housing starts since 2000 (including housing bubble).
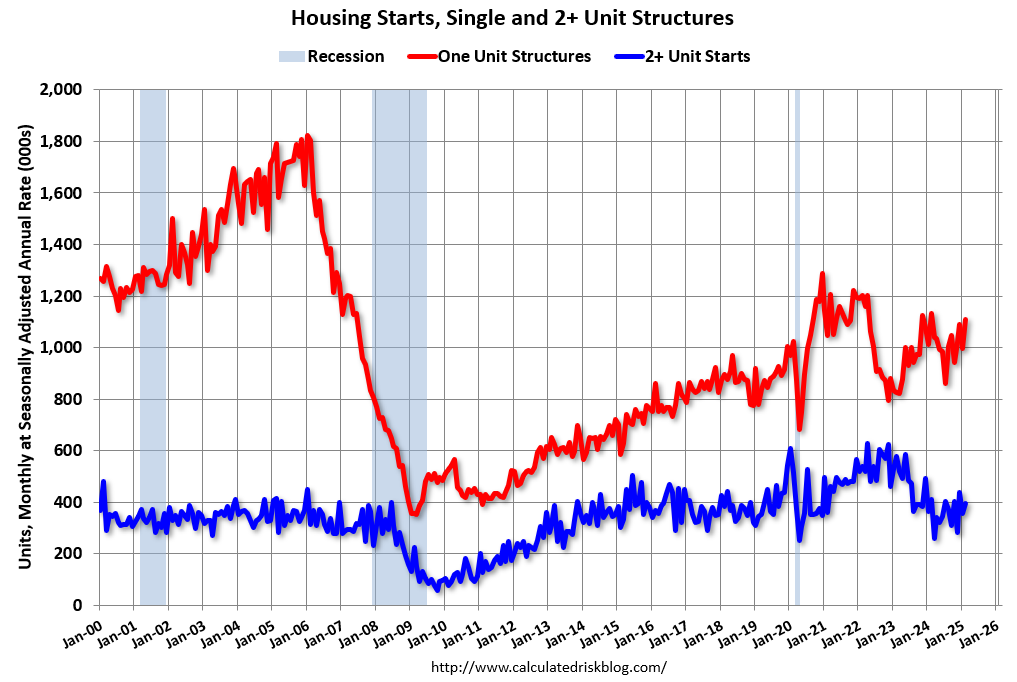
Multi-family starts (blue, 2+ units) increased month-over-month in February. Multi-family starts were down 4.6% year-over-year. Single-family starts (red) increased in February and were down 2.3% year-over-year.
Note that the weakness in 2022 and early 2023 had been in single family starts (red), then the weakness moved to multi-family. Multi-family starts might have bottomed early in 2024.
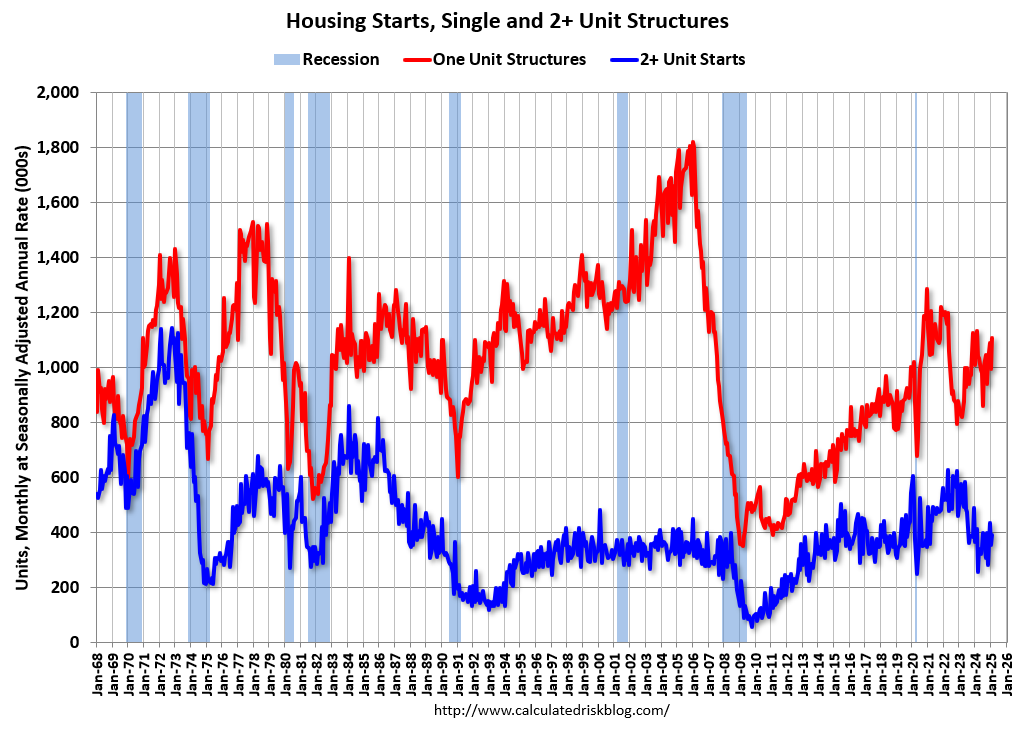
The second graph shows single and multi-family starts since 1968. This shows the huge collapse following the housing bubble, and then the eventual recovery – and the pandemic related volatility.
Total housing starts in February were above expectations; however, starts in December and January were revised down slightly, combined.
The third graph shows the month-to-month comparison for total starts between 2024 (blue) and 2025 (red).
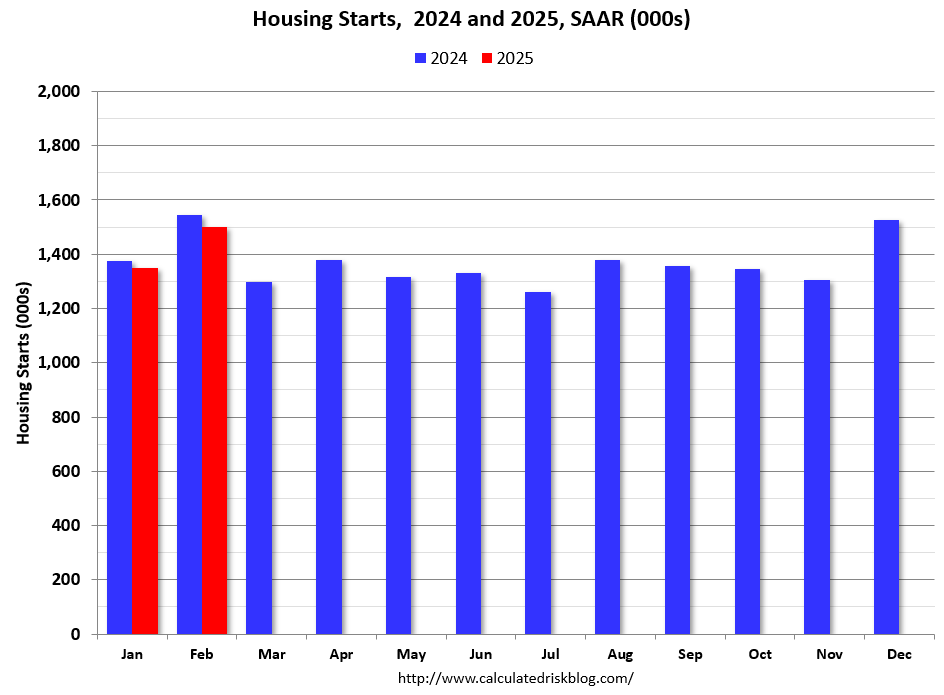
Total starts were down 2.9% in February compared to February 2024. Starts bounced back in the Northeast region after being down sharply year-over-year in January (likely weather related).
Length of Time from Start to Completion Declined in 2024
Census released the annual data on the length of time from start to completion, and this showed the length of time from Start to Completion declined in 2024.
In 2024, it took 7.7 months from start to completion for single family homes, down from a record 8.6 months in 2023. For 2+ unit buildings, it took 16.9 months for buildings with 2 or more units in 2023, down from a record 17.1 months in 2022 and 2023.
Note: This is reported when projects are completed, so the length-of-time will still be elevated for multi-family in 2025.
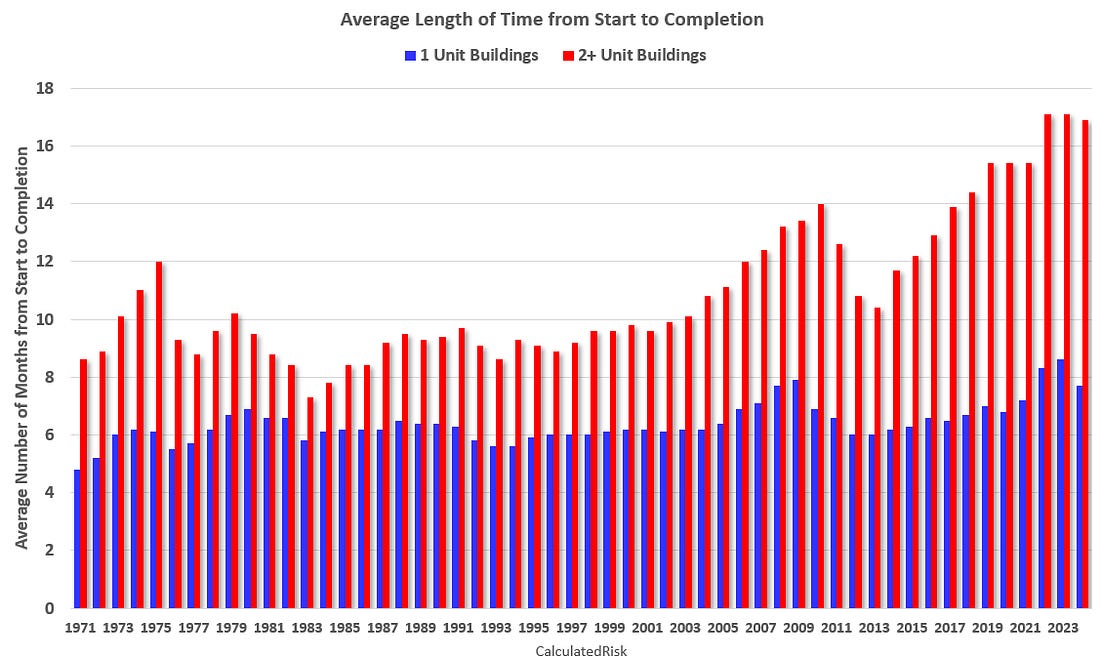
The delays following the housing bubble were due to many projects being mothballed for several years. The recent delays were due to pandemic related supply constraints.
Length of Time from Authorization to Start
From Authorization to Start, it took 1.4 months in 2023 for single family homes, down from a record 1.5 months in 2023. This is normally just below 1.0 month.
And it took 2.7 months in 2024 for 2+ Unit buildings, down from a record 2.8 months in 2022 and 2023. This is normally between 1.5 and 2.0 months.
Multi-Family Housing Units Under Construction Remains Elevated
The fourth graph shows housing starts under construction, Seasonally Adjusted (SA).
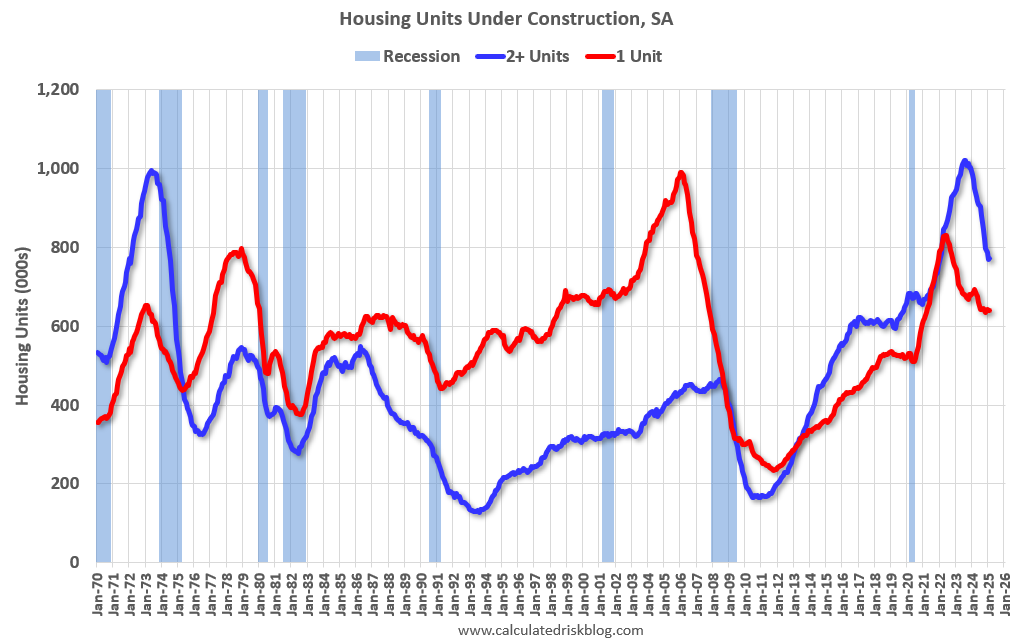
Currently there are 640 thousand single family units (red) under construction (SA). This was unchanged in February compared to January, and 190 thousand below the pandemic peak in May 2022. Single family units under construction peaked in 2022 as supply chain constraints eased.
Currently there are 772 thousand multi-family units (blue) under construction. This was up slightly from 770 thousand in January. This is 249 thousand below the record set in July 2023 of 1,021 thousand. For multi-family, construction delays had been a significant factor, but multi-family units under construction have peaked and declined significantly in 2024 – and will decline further in 2025.
Combined, there are 1.412 million units under construction, 299 thousand below the all-time record of 1.711 million set in October 2022.
In the three years prior to the pandemic, there were about 1.1 to 1.2 million housing units under construction – so the current level is still historically high.
Comparing Starts and Completions
Below is a graph comparing multi-family starts and completions. Since it usually takes over a year on average to complete a multi-family project, there is a lag between multi-family starts and completions. Completions are important because that is new supply added to the market and starts are important because that is future new supply (units under construction is also important for employment).
These graphs use a 12-month rolling total for NSA starts and completions.
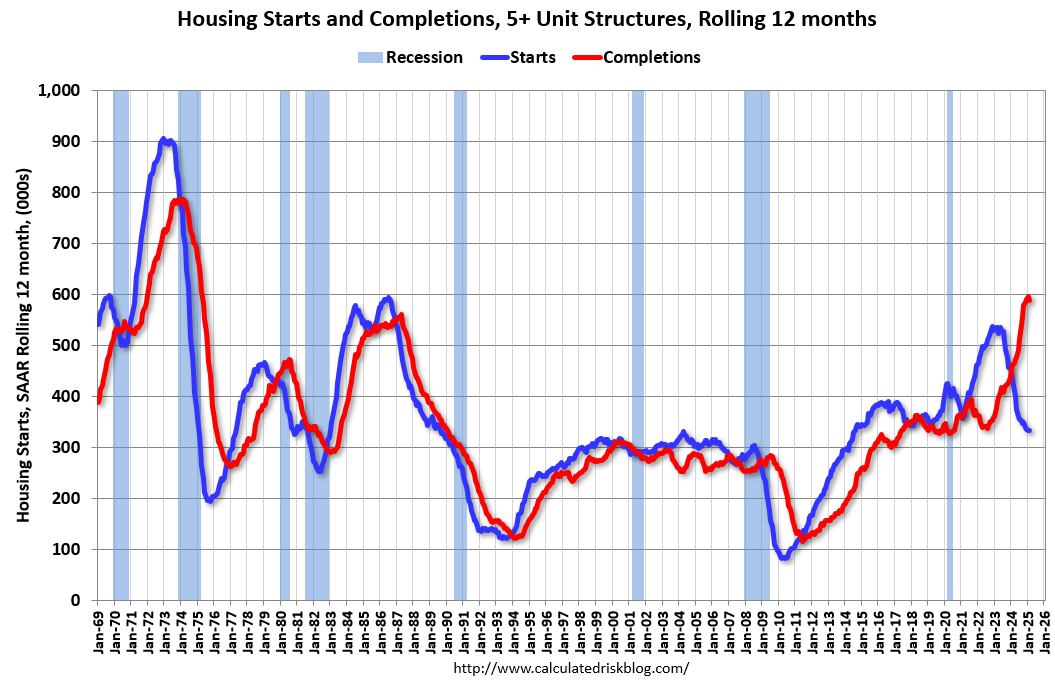
The blue line is for multifamily starts and the red line is for multifamily completions. Builders are now completing many more multifamily housing units than they are starting on a 12-month basis. Multifamily starts might be near a bottom on a rolling 12-month basis, and completions nearing a top.
The last graph shows single family starts and completions. It usually only takes about 6 months between starting a single-family home and completion – so the lines are much closer than for multi-family. The blue line is for single family starts and the red line is for single family completions.
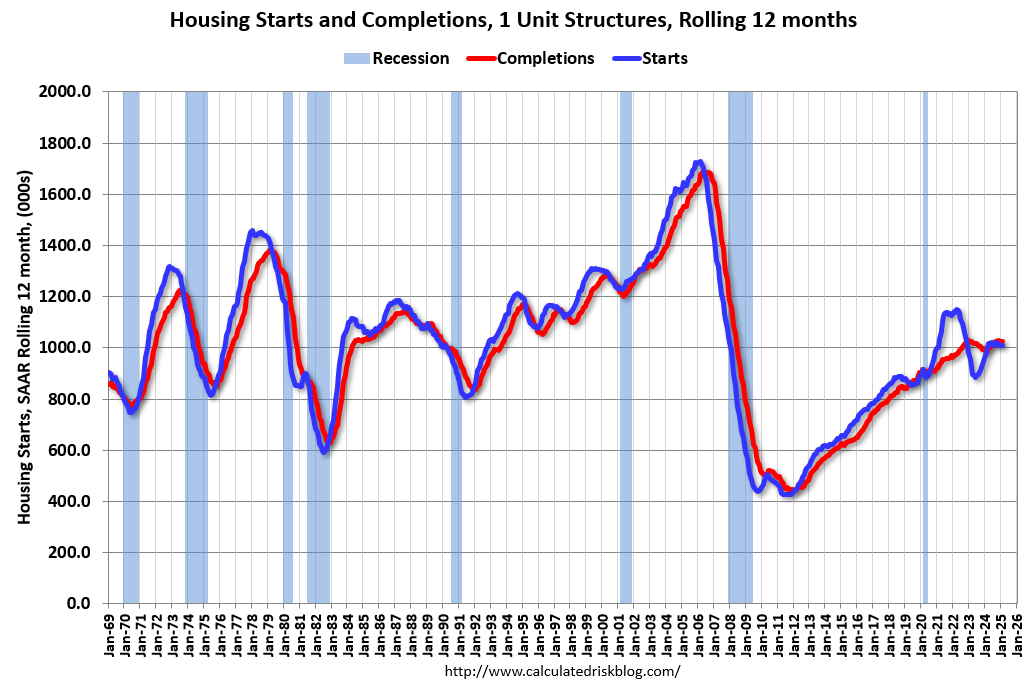
Builders are now starting about the same number of single-family homes as they are completing on a 12-month basis.
Conclusions
Total housing starts in February were above expectations; however, starts in December and January were revised down slightly, combined.
The expected weakness in multi-family starts began in 2023 and it appears multi-family starts are at a bottom.
For multi-family, I’ve been watching leading indicators, such as the National Multifamily Housing Council’s (NMHC’s) Quarterly Survey of Apartment Market Conditions (“Looser market conditions for the tenth consecutive quarter” in January) and the Architectural Billings Index (ABI) for signs of a pickup in the multi-family sector. The ABI for multi-family “remained negative and has been negative for the last 30 months.” This suggests we will see some further weakness in multi-family starts in 2025.
For single family starts, yesterday the NAHB reported:
“Builders continue to face elevated building material costs that are exacerbated by tariff issues, as well as other supply-side challenges that include labor and lot shortages,” said NAHB Chairman Buddy Hughes …
“Construction firms are facing added cost pressures from tariffs,” said NAHB Chief Economist Robert Dietz. “Data from the HMI March survey reveals that builders estimate a typical cost effect from recent tariff actions at $9,200 per home. Uncertainty on policy is also having a negative impact on home buyers and development decisions.” emphasis added
Policy might negatively impact single family starts in 2025.