Calculated Risk
Housing Starts Decreased to 1.309 million Annual Rate in January
From the Census Bureau: Permits, Starts and Completions
Housing Starts:
Privately‐owned housing starts in January were at a seasonally adjusted annual rate of 1,309,000. This is 4.5 percent below the revised December estimate of 1,371,000 and is 21.4 percent below the January 2022 rate of 1,666,000. Single‐family housing starts in January were at a rate of 841,000; this is 4.3 percent below the revised December figure of 879,000. The January rate for units in buildings with five units or more was 457,000.
Building Permits:
Privately‐owned housing units authorized by building permits in January were at a seasonally adjusted annual rate of 1,339,000. This is 0.1 percent above the revised December rate of 1,337,000, but is 27.3 percent below the January 2022 rate of 1,841,000. Single‐family authorizations in January were at a rate of 718,000; this is 1.8 percent below the revised December figure of 731,000. Authorizations of units in buildings with five units or more were at a rate of 563,000 in January.
emphasis added
Possibly Important: Multi-family permits averaged 547,000 SAAR over the last three months after averaging close to 650,000 SAAR over the previous 8 months. This decline in permits is a possible signal that the expected decline in multi-family starts has begun (although permits aren’t a perfect leading indicator for starts).
The first graph shows single and multi-family housing starts since 2000 (including housing bubble).
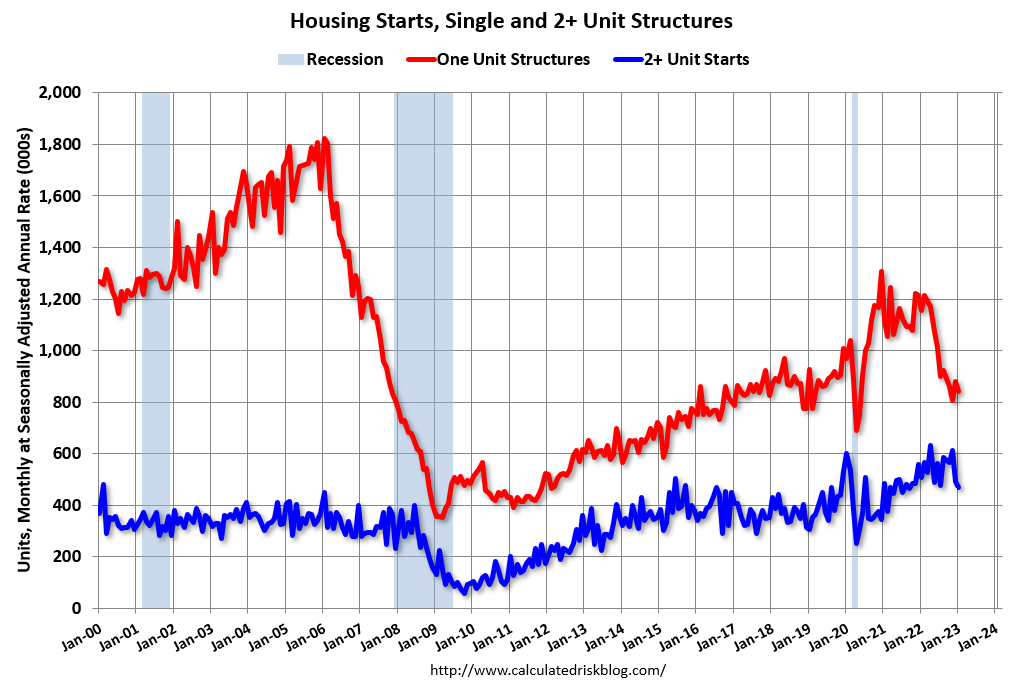
Multi-family starts (blue, 2+ units) decreased in January compared to December. Multi-family starts were down 8.1% year-over-year in January. Single-family starts (red) decreased in January and were down 27.3% year-over-year.
Note that the weakness last year was mostly in single family starts (red), although multi-family starts (blue) have turned down recently.
The second graph shows single and multi-family starts since 1968. This shows the huge collapse following the housing bubble, and then the eventual recovery – and the recent collapse in single-family starts.

Total housing starts in January were below expectations, however, starts in November and December were revised up slightly, combined.
The third graph shows the month-to-month comparison for total starts between 2022 (blue) and 2022 (red).
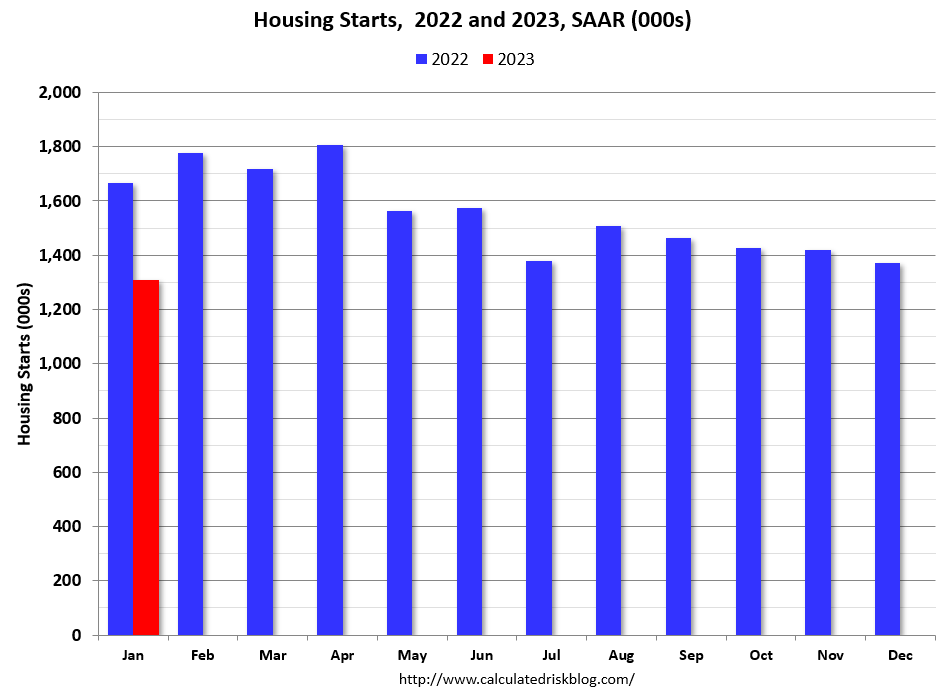
Total starts were down 21.4% in January compared to January 2022. Starts have been down year-over-year for nine consecutive months, and that streak will continue in 2023 and I expect starts to be down significantly this year.
Near Record Number of Housing Units Under Construction
The fourth graph shows housing starts under construction, Seasonally Adjusted (SA).

Red is single family units. Currently there are 752 thousand single family units (red) under construction (SA). This was down in January compared to December, and 76 thousand below the recent peak in April and May 2022. Single family units under construction have peaked since single family starts are now declining. The reason there are still so many homes under construction is probably due to supply constraints.
Blue is for 2+ units. Currently there are 948 thousand multi-family units under construction. This is the highest level since November 1973! For multi-family, construction delays are probably also a factor. The completion of these units should help with rent pressure.
Combined, there are 1.700 million units under construction, just below the all-time record of 1.711 million set in October 2022.
Note: Census will release data in March (part of February survey) on the length of time from start to completion, and that will probably show long delays in 2022. In 2021, it took an average of 7.2 months from start to completion for single family homes (up from 6.8 months for home completed in 2020), and 15.4 months for buildings with 2 or more units.
Comparing Starts and Completions
Below is a graph comparing multi-family starts and completions. Since it usually takes over a year on average to complete a multi-family project, there is a lag between multi-family starts and completions. Completions are important because that is new supply added to the market and starts are important because that is future new supply (units under construction is also important for employment).
These graphs use a 12-month rolling total for NSA starts and completions.
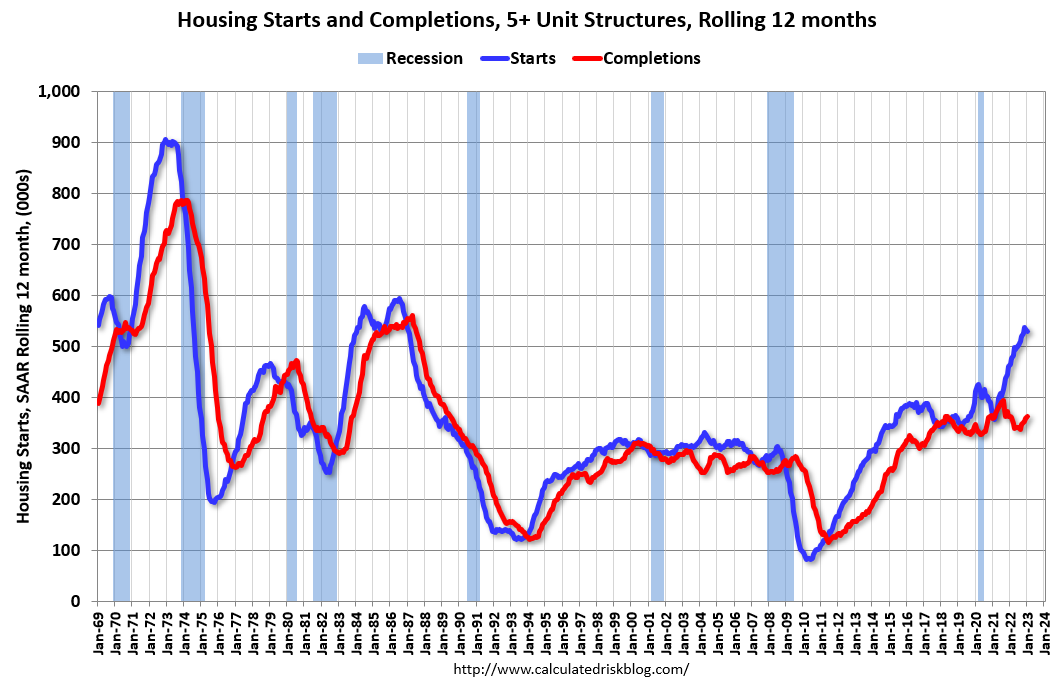
The blue line is for multifamily starts and the red line is for multifamily completions. Builders are still starting more multifamily units than they are completing. Multifamily starts (blue) have started to decline, and completions (red) are picking up – although the gap is still huge.
The last graph shows single family starts and completions. It usually only takes about 6 months between starting a single-family home and completion – so the lines are much closer than for multi-family. The blue line is for single family starts and the red line is for single family completions.
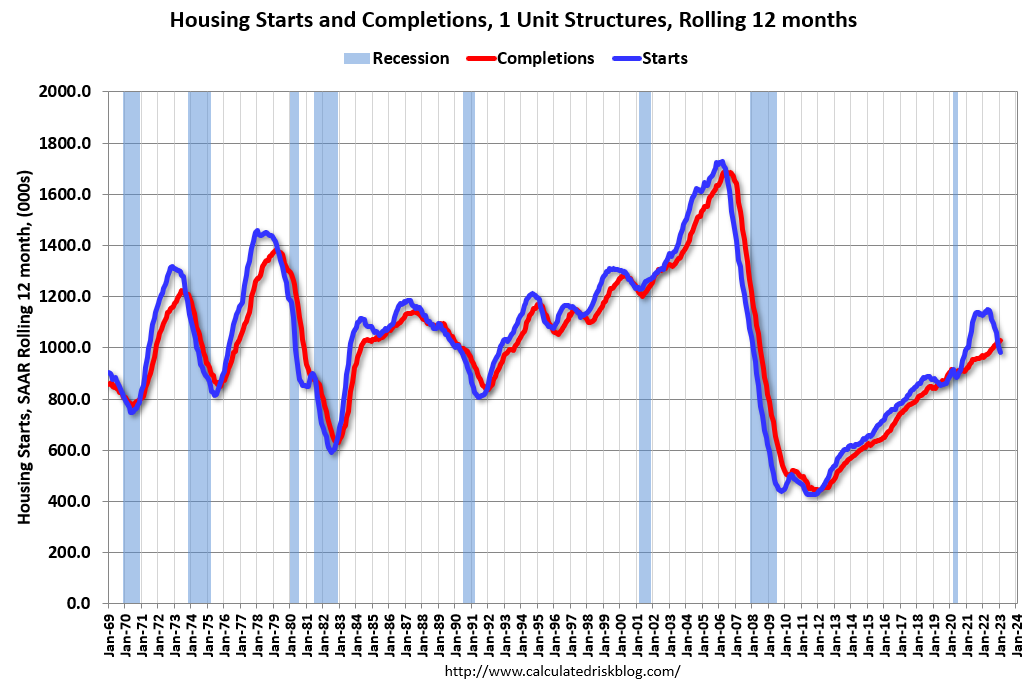
The recent gap between starts and completions has disappeared, and builders are now completing more single-family homes than they are starting. Completions will follow starts down in a few months.
Conclusions
Total housing starts in January were below expectations, however, starts in November and December were revised up, combined. The weakness in 2022 was mostly for single family starts; however, it appears the expected decline in multi-family starts has begun.
A near record number of total housing units are under construction due to construction delays, but the number of single-family housing units under construction is now declining. This means a large number of housing units will be delivered in 2023.