CALCULATEDRISK
By Bill McBride
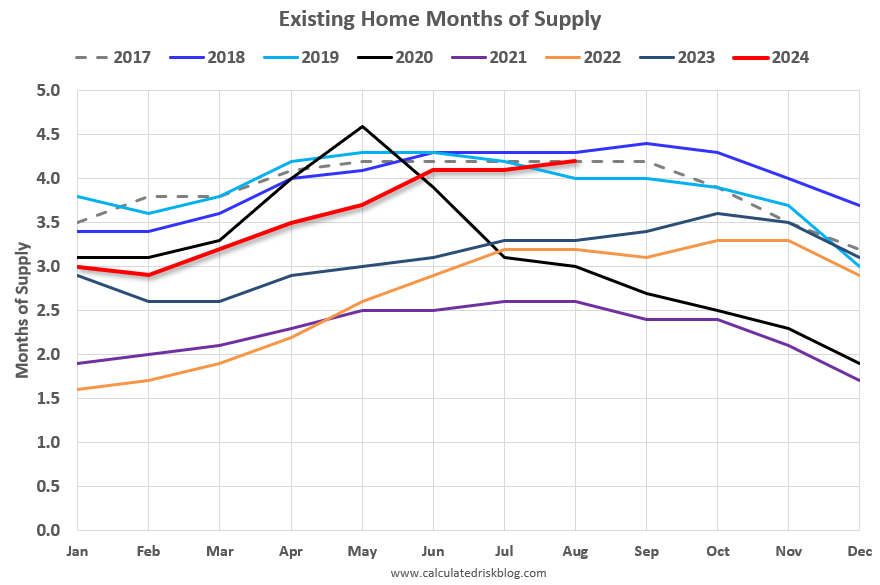
Both inventory and sales are well below pre-pandemic levels, and I think we need to keep an eye on months-of-supply to forecast price changes. Historically nominal prices declined when months-of-supply approached 6 months – and that is unlikely any time soon – however, as expected, months-of-supply is back to 2019 levels.
Months-of-supply was at 4.2 months in August compared to 4.0 months in August 2019. Even though inventory has declined significantly compared to 2019, sales have fallen even more – pushing up months-of-supply.
The following graph shows months-of-supply since 2017. Note that months-of-supply is higher than the last 3 years (2021 – 2023), and above August 2019. Months-of-supply was at 4.2 in August 2017 and 4.3 in August 2018. In 2020 (black), months-of-supply increased at the beginning of the pandemic and then declined sharply.

In an interview in July with Lance Lambert at ResiClub, I noted that house prices might decline if months-of-supply reaches around 5 months:
“I expect this measure to continue to increase, and be over 4 months soon – and to be above 2019 levels in a few months. This doesn’t mean national price declines, but it suggests price growth will slow significantly later this year. We might see national price decline with months-of-supply above 5 (as opposed to 6) since most potential sellers have substantial equity and might be willing to sell for a little less.“
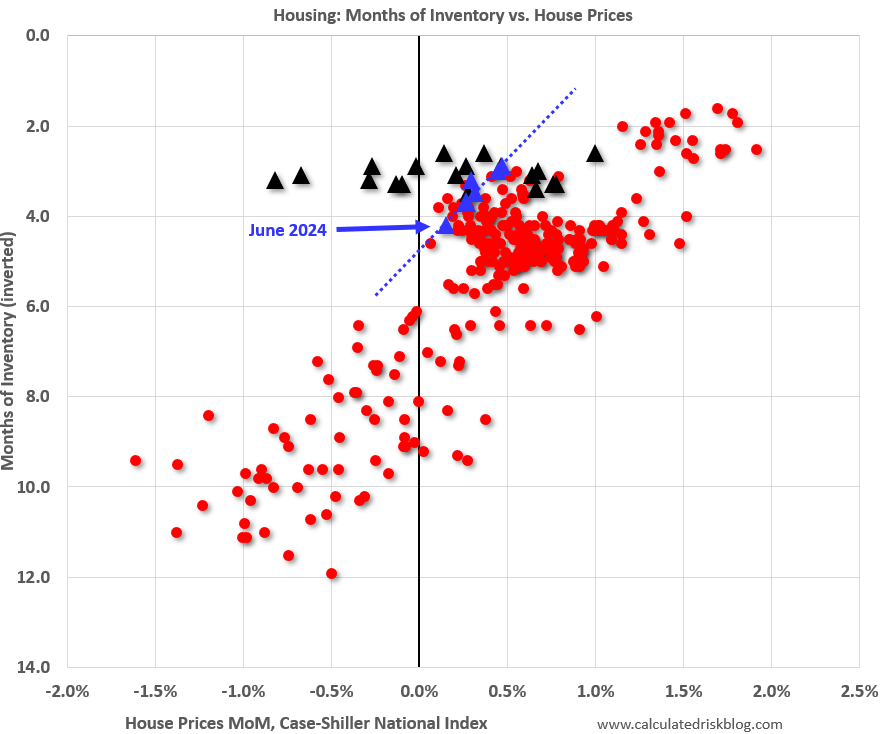
This graph below shows existing home months-of-supply, inverted, from the National Association of Realtors® (NAR) vs. the seasonally adjusted month-to-month price change in the Case-Shiller National Index (both since January 1999 through June 2024). The Case-Shiller index for July will be released tomorrow.
Starting in 2022, the months are in black (the last 6 months in Blue) showing that prices fell for seven months with low levels of inventory in 2022!

In June, the months-of-supply was at 4.2 months, and the Case-Shiller National Index (SA) increased 0.16% month-over-month. If the trend over the last several months (blue dashed line) suggests we might see national price declines if inventory reaches around 5 months of supply. It seems very unlikely we will see 5 months-of-supply this year, but that might be a 2025 story.
What would it take to get months-of-supply above 5 months? If sales stay depressed at 2023 and 2024 levels, how much would inventory have to increase to put months-of-supply at 5 months by, say, June 2024?
Sales in June 2023 were at 4.11 million SAAR, and sales in June 2024 were at 3.90 million SAAR. If sales next June are around 4 million, then inventory would have to increase to 1.67 million units. That would be increase of about 26% year-over-year (compared to June 2024 levels).
If sales increase to say 4.5 million SAAR next June (due to lower mortgage rates), then inventory would have to 1.9 million units, and increase of 42% year-over-year.
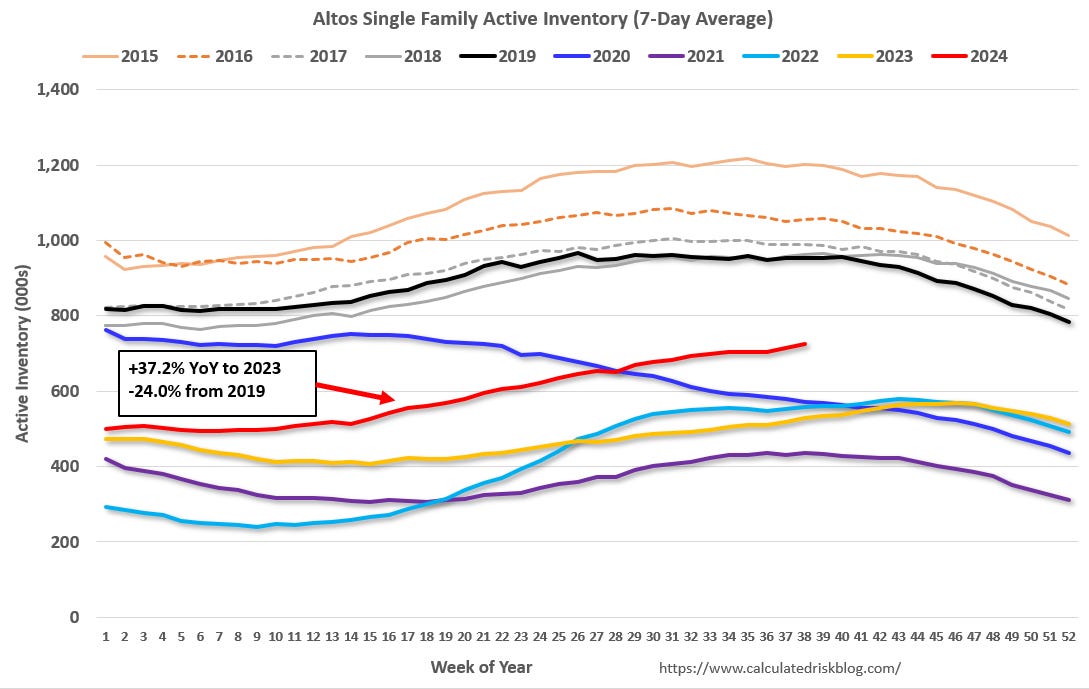
According to Altos Research, single-family inventory was up 37% year-over-year compared to the same week in 2023. This graph shows the seasonal pattern for active single-family inventory since 2015. Note that inventory always decreases seasonally at the end of the year.

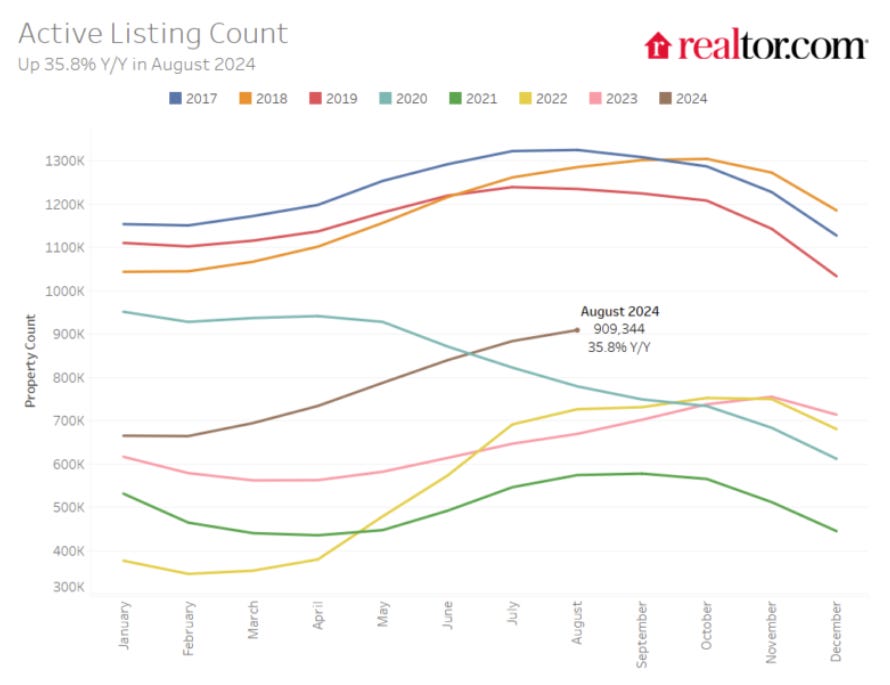
Realtor.com recently reported for August:
There were 35.8% more homes actively for sale on a typical day in August compared with the same time in 2023, marking the tenth consecutive month of annual inventory growth and the highest count post-pandemic. This is a deceleration from July, which was up 36.6% year-over-year. This is the second consecutive month where the rate of growth has decreased from the prior month. While inventory this August certainly continues to improve, it is still down 26.4% compared with typical 2017 to 2019 levels. This is a slight improvement from last month’s 26.8% gap.

If months-of-supply is near 4 months in December, then there is a good chance we will see 5+ months-of-supply next June. This is something I’ll be watching carefully.
